Reproduce
This section of the User Guide describes how to download, configure, build and execute this Reference Software Stack.
Introduction
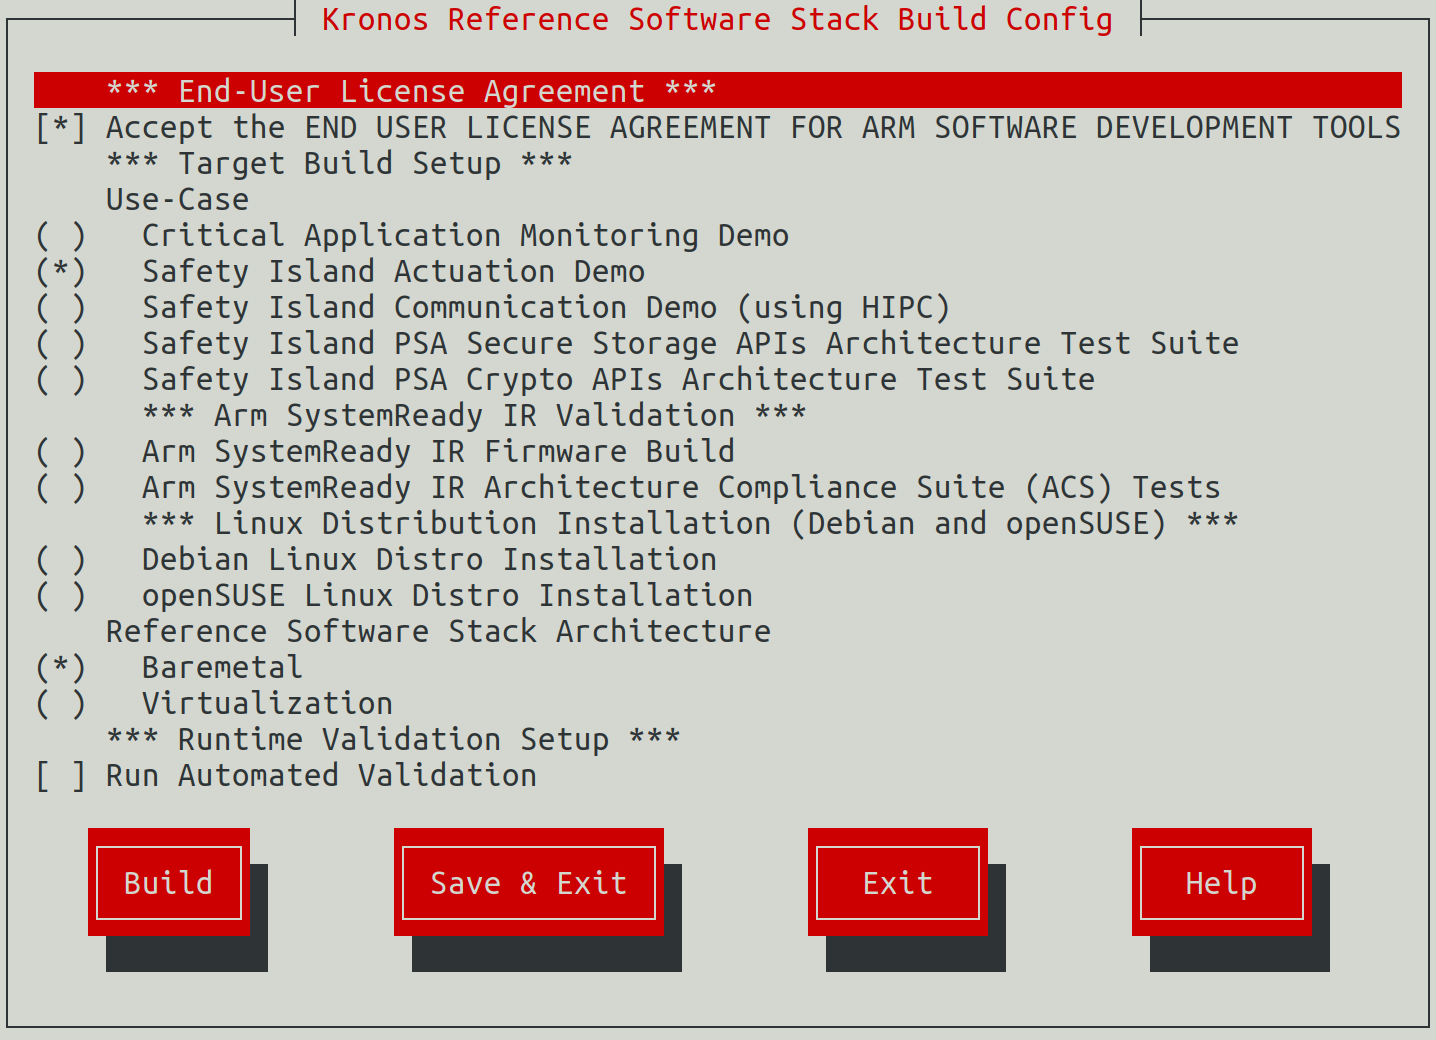
This Reference Software Stack uses the kas menu tool to configure and customize the different Use-Cases via a set of configuration options provided in the configuration menu.
Note
All command examples on this page from the HTML document format can be copied by clicking the copy button. In the PDF document format, be aware that special characters are added when lines get wrapped.
Build Host Environment Setup
System Requirements
x86_64 or aarch64 host to build the stack and execute the Kronos FVP
Ubuntu Desktop or Server 20.04 Linux distribution
At least 500GiB of free disk for the download and builds
At least 32GiB of RAM memory
At least 12GiB of swap memory
Install Dependencies
Follow the Yocto Project documentation on how to install the essential packages required for the build host. The packages needed to build the Yocto Project documentation manuals are not required.
Install the kas tool and its optional dependency (to use the “menu” plugin):
sudo -H pip3 install --upgrade kas==4.2 && sudo apt install python3-newtFor more details on kas installation, see kas Dependencies & installation.
Install tmux (required for the
runfvptool):sudo apt install tmux
Download
Note
Performing the builds and FVP execution in a tmux session is mandatory for
Kronos because the runfvp tool that invokes the Kronos FVP expects the
presence of a tmux session to attach its spawned tmux windows for console
access to the processing elements. Refer to
Tmux Documentation for more information on the usage of tmux. It is
recommended to change the default history-limit by adding
set-option -g history-limit 3000 to ~/.tmux.conf before starting
tmux.
Start a new tmux session, via:
tmux new-session -s kronos
To reconnect to an existing tmux session:
tmux attach -t kronos
Download the kronos repository using Git and checkout on the kronos branch,
via:
mkdir -p ~/kronos
cd ~/kronos
git clone https://git.gitlab.arm.com/automotive-and-industrial/kronos-ref-stack/kronos.git --branch v1.0
Reproducing the Use-Cases
General
Kas Build
The Kronos stack has a kas configuration menu that can be used to build the Use-Cases. It can also apply customizable parameters to build different Reference Software Stack Architecture types.
Note
Before running the configuration menu, ensure it is done inside a tmux session.
To run the configuration menu:
kas menu kronos/Kconfig
Note
To build and run any image for the Kronos FVP the user has to accept its EULA, which can be done by selecting the corresponding configuration option in the build setup. The Safety Island Actuation Demo is built as part of the default deployment.
The kas build configuration menu selections performed in each use-case are saved. Ensure to only select the options mentioned in the use-case reproduce steps and deselect any other non-relevant ones.
FVP
The runfvp tool that invokes the Kronos FVP creates one tmux terminal
window per processing element. The default window displayed will be that of the
Primary Compute terminal titled as terminal_ns_uart0. User may press
Ctrl-b w to see the list of tmux windows and use arrow keys to navigate
through the windows and press Enter to select any processing element
terminal.
The Reference Software Stack running on the Primary Compute can be logged into
as root user without a password in the Linux terminal.
Note
FVPs, and Fast Models in general, are functionally accurate, meaning that they fully execute all instructions correctly, however they are not cycle accurate. The main goal of the Reference Software Stack is to prove functionality only, and should not be used for performance analysis.
Critical Application Monitoring Demo
The demo can be run on the Baremetal Architecture or Virtualization Architecture. See Critical Application Monitoring Demo for further details.
Baremetal Architecture
Build
To run the configuration menu:
kas menu kronos/Kconfig
To build a Baremetal Architecture image:
Select
Critical Application Monitoring Demofrom theUse-Casemenu.Select
Baremetalfrom theReference Software Stack Architecturemenu.Select
Build.
Run the FVP
To start the FVP and connect to the Primary Compute terminal (running Linux):
kas shell -c "../layers/meta-arm/scripts/runfvp -t tmux --verbose"
The user should wait for the system to boot and for the Linux prompt to appear.
The Safety Island (SI) Cluster 1 terminal running cam-service is available
via the tmux window titled terminal_uart_si_cluster1. For ease of
navigation, it’s recommended to join the SI Cluster 1 terminal window to the
Primary Compute terminal window in order to issue commands on it.
Follow the steps below to achieve the same:
Ensure that the tmux window titled
terminal_ns_uart0is selected. If not, pressCtrl-b wfrom the tmux session, navigate to the tmux window titledterminal_ns_uart0using the arrow keys, then press theEnterkey.Press
Ctrl-b :and then typejoin-pane -s :terminal_uart_si_cluster1 -hfollowed by pressingEnterkey to join the SI Cluster 1 terminal window to the Primary Compute terminal window.
Refer to the following image of the tmux panes rearrangement. Panes can
be navigated using Ctrl-b followed by the arrow keys.
The Reference Software Stack running on the Primary Compute can be logged into
as root user without a password in the Linux terminal. Run the below
command to guarantee that all the expected services have been
initialized.
systemctl is-system-running --wait
Wait for it to return. The expected terminal output is running.
Run the Demo
Before running cam-app-example, .csd files corresponding to event
streams produced by cam-app-example must be created and deployed to the
system where cam-service runs (in this case SI Cluster 1). Run
cam-app-example in calibration mode and then use cam-tool to generate
the .csd files.
Start
cam-app-examplein calibration mode from the Primary Compute terminal:cam-app-example -u 11085ddc-bc10-11ed-9a44-7ef9696e -t 3000 -c 10 -s 4 -C
The stream event log files (
.csel) for each stream are generated. The output should look as below:Cam application configuration: Service IP address: 127.0.0.1 Service port: 21604 UUID base: 11085ddc-bc10-11ed-9a44-7ef9696e Stream count: 4 Processing period (ms): 3000 Processing count: 10 Multiple connection support: false Calibration mode support: true Calibration directory: ./[uuid].csel Fault injection support: false Event(s) interval time (ms): 0 Using libcam v1.0 Starting activity... Starting activity... Starting activity... Starting activity... Stream 0 sends event 0 Stream 1 sends event 0 Stream 2 sends event 0 Stream 3 sends event 0 ...List the files generated:
ls -1 *.csel
The stream event log files can be shown as below:
11085ddc-bc10-11ed-9a44-7ef9696e0000.csel
11085ddc-bc10-11ed-9a44-7ef9696e0001.csel
11085ddc-bc10-11ed-9a44-7ef9696e0002.csel
11085ddc-bc10-11ed-9a44-7ef9696e0003.csel
Run
cam-toolfrom the Primary Compute terminal to analyze stream event log files and convert them to stream configuration files (.csc.yml).cam-tool analyze -m 1000000 -i 11085ddc-bc10-11ed-9a44-7ef9696e0000.csel
The analysis result is reported from the Primary Compute terminal as below, the timeout value might change:
CAM event log analyze report:
Input event log file:                   11085ddc-bc10-11ed-9a44-7ef9696e0000.csel
Output configuration file:              analyzed.csc.yml
Stream UUID:                            11085ddc-bc10-11ed-9a44-7ef9696e0000
Stream name:                            CAM STREAM  0
Timeout between init and start:         300000
Timeout between start and event:        450000
Application running times:              1
Processing count in each run:           [10]

Event ID        timeout
0               4000106
The stream configuration files contain human-readable settings used for the deployment phase of a critical application. Users can modify this configuration, for example to fine tune timeout values depending on the system capabilities.
Run
cam-toolthree more times for each of the other three streams.cam-tool analyze -m 1000000 -i 11085ddc-bc10-11ed-9a44-7ef9696e0001.csel cam-tool analyze -m 1000000 -i 11085ddc-bc10-11ed-9a44-7ef9696e0002.csel cam-tool analyze -m 1000000 -i 11085ddc-bc10-11ed-9a44-7ef9696e0003.csel
Then, use the
cam-tool packcommand for each of the streams to generate deployment data.cam-tool pack -i 11085ddc-bc10-11ed-9a44-7ef9696e0000.csc.yml cam-tool pack -i 11085ddc-bc10-11ed-9a44-7ef9696e0001.csc.yml cam-tool pack -i 11085ddc-bc10-11ed-9a44-7ef9696e0002.csc.yml cam-tool pack -i 11085ddc-bc10-11ed-9a44-7ef9696e0003.csc.yml
Run the
cam-tool deploycommand from the Primary Compute terminal to transfer the generated stream deployment data to SI Cluster 1 (wherecam-serviceis running):cam-tool deploy -i 11085ddc-bc10-11ed-9a44-7ef9696e0000.csd -a 192.168.1.1
The output on the SI Cluster 1 terminal should look as below, the connection number might change:
Connection 4 is created.
Deploy Message

Connection 4 is closed.
After that, the stream data of
11085ddc-bc10-11ed-9a44-7ef9696e0000is deployed to thecam-servicefile system.Running
cam-tool deploythree more times can deploy the data of three other streams tocam-service.cam-tool deploy -i 11085ddc-bc10-11ed-9a44-7ef9696e0001.csd -a 192.168.1.1 cam-tool deploy -i 11085ddc-bc10-11ed-9a44-7ef9696e0002.csd -a 192.168.1.1 cam-tool deploy -i 11085ddc-bc10-11ed-9a44-7ef9696e0003.csd -a 192.168.1.1
The output on the SI Cluster 1 terminal after each one of the
cam-tool deploycommand should look as below, the connection number might change:Connection 4 is created. Deploy Message Connection 4 is closed.
List all the files from the SI Cluster 1 terminal:
fs ls RAM:/
The stream deployment data can be shown as below:
11085ddc-bc10-11ed-9a44-7ef9696e0000.csd 11085ddc-bc10-11ed-9a44-7ef9696e0001.csd 11085ddc-bc10-11ed-9a44-7ef9696e0002.csd 11085ddc-bc10-11ed-9a44-7ef9696e0003.csd
Start
cam-app-examplefrom the Primary Compute terminal to create an application with four streams. Each stream sends an event message 10 times with a period of 3000 milliseconds.cam-app-example -u 11085ddc-bc10-11ed-9a44-7ef9696e -t 3000 -c 10 -s 4 -a 192.168.1.1
The following configure messages are expected from the Primary Compute terminal:
Cam application configuration: Service IP address: 192.168.1.1 Service port: 21604 UUID base: 11085ddc-bc10-11ed-9a44-7ef9696e Stream count: 4 Processing period (ms): 3000 Processing count: 10 Multiple connection support: false Calibration mode support: false Fault injection support: false Event(s) interval time (ms): 0 Using libcam v1.0 Starting activity... Starting activity... Starting activity... Starting activity...And the log of sent event messages are shown repeatedly:
Stream 0 sends event 0 Stream 1 sends event 0 Stream 2 sends event 0 Stream 3 sends event 0 Stream 0 sends event 0 Stream 1 sends event 0 Stream 2 sends event 0 Stream 3 sends event 0 ...
As observed from the SI Cluster 1 terminal,
cam-serviceis loading four stream deployment files for monitoring. In the following log, the stream messages are received and processed by it:Connection 4 is created. Init Message Stream 11085ddc-bc10-11ed-9a44-7ef9696e0001 configuration is loaded. Init Message Stream 11085ddc-bc10-11ed-9a44-7ef9696e0000 configuration is loaded. Init Message Stream 11085ddc-bc10-11ed-9a44-7ef9696e0002 configuration is loaded. Init Message Stream 11085ddc-bc10-11ed-9a44-7ef9696e0003 configuration is loaded. Start Message Start Message Start Message Start Message Event Message Event Message Event Message Event Message Event Message # Repeated event messages ...
cam-app-examplehas a mode to inject a fault to test the CAM framework. Runcam-app-exampleagain from the Primary Compute terminal with fault injection to event stream 0:cam-app-example -u 11085ddc-bc10-11ed-9a44-7ef9696e -t 3000 -c 10 -s 4 -f -S 0 -T 1000 -a 192.168.1.1
The following configure messages are expected from the Primary Compute terminal:
Cam application configuration: Service IP address: 192.168.1.1 Service port: 21604 UUID base: 111085ddc-bc10-11ed-9a44-7ef9696e Stream count: 4 Processing period (ms): 3000 Processing count: 10 Multiple connection support: false Calibration mode support: false Fault injection support: true Fault injection time: 1000 Fault injection stream: 0 Event(s) interval time (ms): 0 Using libcam v1.0 Starting activity... Starting activity... Starting activity... Starting activity...And the log of sent event messages are shown repeatedly:
Stream 0 sends event 0 Stream 1 sends event 0 Stream 2 sends event 0 Stream 3 sends event 0 Stream 0 sends event 0 Stream 1 sends event 0 Stream 2 sends event 0 Stream 3 sends event 0 ...
The fault happens 1000ms after stream initialization. At that time
cam-serviceshould detect a stream temporal error with the following output from the SI Cluster 1 terminal.# Repeated event messages ... ERROR: Stream temporal error: ERROR: stream_name: CAM STREAM 0 ERROR: stream_uuid: 11085ddc-bc10-11ed-9a44-7ef9696e0000 ERROR: event_id: 0 ERROR: time_received: 0 ERROR: time_expected: 1710328901375511 # Repeated event messages ... ERROR: Stream state error: ERROR: stream_name: CAM STREAM 0 ERROR: stream_uuid: 11085ddc-bc10-11ed-9a44-7ef9696e0000 ERROR: timestamp: 1710328927375278 ERROR: current_state: Failed state ERROR: requested_state: In-progress state
Note
time_received: 0 should be ignored as the time_received is not set
during a fault.
To shut down the FVP and terminate the emulation automatically, issue the following command on the Primary Compute terminal.
shutdown now
The below messages indicate the shutdown process is complete.
[ OK ] Finished System Power Off. [ OK ] Reached target System Power Off. reboot: Power down
Automated Validation
Ensure the creation of the initial firmware flash images because previously updated firmware will lead to failure of the tests.
kas shell -c "bitbake ap-flash-image rss-flash-image -C image"
To run the configuration menu:
kas menu kronos/Kconfig
To run the validation tests:
Select
Critical Application Monitoring DemoasUse-Case.Select
Baremetalfrom theReference Software Stack Architecturemenu.Select
Run Automated Validationfrom theRuntime Validation Setupmenu.Select
Build.
The complete test suite takes around 40 minutes to complete. See Integration Tests Validating the Critical Application Monitoring Demo for more details.
The following messages are expected in the output to validate this Use-Case:
RESULTS - test_40_cam.CAMServiceTest.test_cam_service_boot_on_si: PASSED (0.00s)
RESULTS - test_40_cam.CAMTest.test_cam_app_example_to_service_on_si: PASSED (36.89s)
RESULTS - test_40_cam.CAMTest.test_cam_app_example_to_service_on_si_with_multiple_connections: PASSED (36.98s)
RESULTS - test_40_cam.CAMTest.test_cam_ptp_sync: PASSED (0.00s)
RESULTS - test_40_cam.CAMTest.test_cam_tool_deploy_to_si: PASSED (75.69s)
RESULTS - test_40_cam.CAMTest.test_cam_tool_pack: PASSED (74.72s)
RESULTS - test_40_cam.CAMTest.test_data_calibration: PASSED (187.73s)
RESULTS - test_40_cam.CAMTest.test_logical_check_on_si: PASSED (15.63s)
RESULTS - test_40_cam.CAMTest.test_temporal_check_on_si: PASSED (44.32s)
Note
There is a rare known failure where a timeout might occur during test execution. Refer to Known Issues for possible workarounds.
Virtualization Architecture
Build
To run the configuration menu:
kas menu kronos/Kconfig
To build a Virtualization Architecture image:
Select
Critical Application Monitoring Demofrom theUse-Casemenu.Select
Virtualizationfrom theReference Software Stack Architecturemenu.Select
Build.
Run the FVP
To start the FVP and connect to the Primary Compute terminal (running Linux):
kas shell -c "../layers/meta-arm/scripts/runfvp -t tmux --verbose"
The user should wait for the system to boot and for the Linux prompt to appear.
The Safety Island (SI) Cluster 1 terminal running cam-service is available
via the tmux window titled terminal_uart_si_cluster1. For ease of
navigation, it’s recommended to join the SI Cluster 1 terminal window to the
Primary Compute terminal window in order to issue commands on it.
Follow the steps below to achieve the same:
Ensure that the tmux window titled
terminal_ns_uart0is selected. If not, pressCtrl-b wfrom the tmux session, navigate to the tmux window titledterminal_ns_uart0using the arrow keys, then press theEnterkey.Press
Ctrl-b :and then typejoin-pane -s :terminal_uart_si_cluster1 -hfollowed by pressingEnterkey to join the SI Cluster 1 terminal window to the Primary Compute terminal window.
Since both DomU1 and DomU2 will be used to run cam-app-example, it is also
recommended to create a tmux pane to connect to DomU2.
Press
Ctrl-band the arrow keys to navigate to theterminal_ns_uart0pane.Press
Ctrl-b "to split the pane horizontally. The bottom pane will be used to connect to DomU2.
Please refer to the following image of the tmux panes rearrangement. Panes can
be navigated using Ctrl-b followed by the arrow keys.
The Reference Software Stack running on the Primary Compute can be logged into
as root user without a password in the Linux terminal. Run the below
command to guarantee that all the expected services have been
initialized.
systemctl is-system-running --wait
Wait for it to return. The expected terminal output is running.
Note
A message similar to the following might appear in the Primary Compute
terminal (XEN) d2v0: vGICR: SGI: unhandled word write 0x000000ffffffff
to ICACTIVER0, this is an expected behavior.
Run the Demo
Before running cam-app-example, .csd files corresponding to event
streams produced by cam-app-example must be created and deployed to the
system where cam-service runs (in this case SI Cluster 1). Run
cam-app-example in calibration mode and then use cam-tool to generate
the .csd files.
From the Primary Compute terminal, enter the DomU1 console using the
xltool:xl console domu1
DomU1 can be logged into as
rootuser without a password in the Linux terminal. This command will provide a console on the DomU1. To exit, enterCtrl-](to access the FVP telnet shell), followed by typingsend escinto the telnet shell and pressingEnter. See the xl documentation for further details.To improve the readability of commands and output on the DomU1 console, run the command below:
stty rows 76 cols 282
From the host terminal, SSH to the FVP then enter the DomU2 console using the
xltool:ssh [email protected] -p 2222 xl console domu2
DomU2 can be logged into as
rootuser without a password in the Linux terminal. This command will provide a console on the DomU2. To exit, enterCtrl-](to access the FVP telnet shell), followed by typingsend escinto the telnet shell and pressingEnter. See the xl documentation for further details.To improve the readability of commands and output on the DomU2 console, run the command below:
stty rows 76 cols 282
From the DomU1 terminal, check that the clock is synchronized using the command
timedatectl, one of the line of its output needs to beSystem clock synchronized: yesto confirm that the clock is synchronized:timedatectl
The output should look as below, the date and time can differ, in case the
System clock synchronized:shows thenovalue, allow at least 1 minute for the system to settle and for the clock to synchronize, afterwards repeat the step 5 untilSystem clock synchronized: yesis shown in the output:Local time: Thu 2024-03-14 12:56:26 UTC Universal time: Thu 2024-03-14 12:56:26 UTC RTC time: n/a Time zone: UTC (UTC, +0000) System clock synchronized: yes NTP service: n/a RTC in local TZ: noStart
cam-app-examplein calibration mode from the DomU1 terminal:cam-app-example -u 11085ddc-bc10-11ed-9a44-7ef9696e -t 3000 -c 10 -s 4 -C
The stream event log files (
.csel) for each stream are generated. The output should look as below:Cam application configuration: Service IP address: 127.0.0.1 Service port: 21604 UUID base: 11085ddc-bc10-11ed-9a44-7ef9696e Stream count: 4 Processing period (ms): 3000 Processing count: 10 Multiple connection support: false Calibration mode support: true Calibration directory: ./[uuid].csel Fault injection support: false Event(s) interval time (ms): 0 Using libcam v1.0 Starting activity... Starting activity... Starting activity... Starting activity... Stream 0 sends event 0 Stream 1 sends event 0 Stream 2 sends event 0 Stream 3 sends event 0 ...List the files generated:
ls -1 *.csel
The stream event log files can be shown as below:
11085ddc-bc10-11ed-9a44-7ef9696e0000.csel 11085ddc-bc10-11ed-9a44-7ef9696e0001.csel 11085ddc-bc10-11ed-9a44-7ef9696e0002.csel 11085ddc-bc10-11ed-9a44-7ef9696e0003.csel
Run
cam-toolfrom the DomU1 terminal to analyze stream event log files and convert them to stream configuration files (.csc.yml).cam-tool analyze -m 1000000 -i 11085ddc-bc10-11ed-9a44-7ef9696e0000.csel
The analysis result is reported from the DomU1 terminal as below, the timeout value might change:
CAM event log analyze report: Input event log file: 11085ddc-bc10-11ed-9a44-7ef9696e0000.csel Output configuration file: analyzed.csc.yml Stream UUID: 11085ddc-bc10-11ed-9a44-7ef9696e0000 Stream name: CAM STREAM 0 Timeout between init and start: 300000 Timeout between start and event: 450000 Application running times: 1 Processing count in each run: [10] Event ID timeout 0 4000072
The stream configuration files contain human-readable settings used for the deployment phase of a critical application. Users can modify this configuration, for example to fine tune timeout values depending on the system capabilities.
Run
cam-toolthree more times for each of the other three streams.cam-tool analyze -m 1000000 -i 11085ddc-bc10-11ed-9a44-7ef9696e0001.csel
cam-tool analyze -m 1000000 -i 11085ddc-bc10-11ed-9a44-7ef9696e0002.csel
cam-tool analyze -m 1000000 -i 11085ddc-bc10-11ed-9a44-7ef9696e0003.csel
Then, use the
cam-tool packcommand for each of the streams to generate deployment data.cam-tool pack -i 11085ddc-bc10-11ed-9a44-7ef9696e0000.csc.yml
cam-tool pack -i 11085ddc-bc10-11ed-9a44-7ef9696e0001.csc.yml
cam-tool pack -i 11085ddc-bc10-11ed-9a44-7ef9696e0002.csc.yml
cam-tool pack -i 11085ddc-bc10-11ed-9a44-7ef9696e0003.csc.yml
Run the
cam-tool deploycommand from the DomU1 terminal to transfer the generated stream deployment data to SI Cluster 1 (wherecam-serviceis running):cam-tool deploy -i 11085ddc-bc10-11ed-9a44-7ef9696e0000.csd -a 192.168.1.1
The output on the SI Cluster 1 terminal should look as below, the connection number might change:
Connection 4 is created.
Deploy Message

Connection 4 is closed.
After that, the stream data of
11085ddc-bc10-11ed-9a44-7ef9696e0000is deployed to thecam-servicefile system.Running
cam-tool deploythree more times can deploy the data of three other streams tocam-service.cam-tool deploy -i 11085ddc-bc10-11ed-9a44-7ef9696e0001.csd -a 192.168.1.1
cam-tool deploy -i 11085ddc-bc10-11ed-9a44-7ef9696e0002.csd -a 192.168.1.1
cam-tool deploy -i 11085ddc-bc10-11ed-9a44-7ef9696e0003.csd -a 192.168.1.1
The output on the SI Cluster 1 terminal after each one of the
cam-tool deploycommand should look as below, the connection number might change:Connection 4 is created. Deploy Message Connection 4 is closed.
From the DomU2 terminal, check that the clock is synchronized using the command
timedatectl, one of the line of its output needs to beSystem clock synchronized: yesto confirm that the clock is synchronized:timedatectl
The output should look as below, the date and time can differ, in case the
System clock synchronized:shows thenovalue, allow at least 1 minute for the system to settle and for the clock to synchronize, afterwards repeat the step 9 untilSystem clock synchronized: yesis shown in the output:Local time: Thu 2024-03-14 12:56:26 UTC Universal time: Thu 2024-03-14 12:56:26 UTC RTC time: n/a Time zone: UTC (UTC, +0000) System clock synchronized: yes NTP service: n/a RTC in local TZ: noStart
cam-app-examplein calibration mode from the DomU2 terminal:cam-app-example -u 22085ddc-bc10-11ed-9a44-7ef9696e -t 2000 -c 5 -s 2 -C
The stream event log files (
.csel) for each stream are generated. The output should look as below:Cam application configuration: Service IP address: 127.0.0.1 Service port: 21604 UUID base: 22085ddc-bc10-11ed-9a44-7ef9696e Stream count: 2 Processing period (ms): 2000 Processing count: 5 Multiple connection support: false Calibration mode support: true Calibration directory: ./[uuid].csel Fault injection support: false Event(s) interval time (ms): 0 Using libcam v1.0 Starting activity... Starting activity... Stream 0 sends event 0 Stream 1 sends event 0 ...List the files generated:
ls -1 *.csel
The stream event log files can be shown as below:
22085ddc-bc10-11ed-9a44-7ef9696e0000.csel 22085ddc-bc10-11ed-9a44-7ef9696e0001.csel
Run
cam-toolfrom the DomU2 terminal to analyze stream event log files and convert them to stream configuration files (.csc.yml).cam-tool analyze -m 1000000 -i 22085ddc-bc10-11ed-9a44-7ef9696e0000.csel
The analysis result is reported from the DomU2 terminal as below, the timeout value might change:
CAM event log analyze report: Input event log file: 22085ddc-bc10-11ed-9a44-7ef9696e0000.csel Output configuration file: analyzed.csc.yml Stream UUID: 22085ddc-bc10-11ed-9a44-7ef9696e0000 Stream name: CAM STREAM 0 Timeout between init and start: 300000 Timeout between start and event: 450000 Application running times: 1 Processing count in each run: [5] Event ID timeout 0 3000001
The stream configuration files contain human-readable settings used for the deployment phase of a critical application. Users can modify this configuration, for example to fine tune timeout values depending on the system capabilities.
Run
cam-toolfor the other stream.cam-tool analyze -m 1000000 -i 22085ddc-bc10-11ed-9a44-7ef9696e0001.csel
Then, use the
cam-tool packcommand for each of the streams to generate deployment data.cam-tool pack -i 22085ddc-bc10-11ed-9a44-7ef9696e0000.csc.yml cam-tool pack -i 22085ddc-bc10-11ed-9a44-7ef9696e0001.csc.yml
Run the
cam-tool deploycommand from the DomU2 terminal to transfer the generated stream deployment data to SI Cluster 1 (wherecam-serviceis running):cam-tool deploy -i 22085ddc-bc10-11ed-9a44-7ef9696e0000.csd -a 192.168.1.1
The output on the SI Cluster 1 terminal should look as below, the connection number might change:
Connection 4 is created. Deploy Message Connection 4 is closed.
After that, the stream data of
22085ddc-bc10-11ed-9a44-7ef9696e0000is deployed to thecam-servicefile system.Running
cam-tool deployone more time deploys the data of the other stream tocam-service.cam-tool deploy -i 22085ddc-bc10-11ed-9a44-7ef9696e0001.csd -a 192.168.1.1
The output on the SI Cluster 1 terminal after each one of the
cam-tool deploycommand should look as below, the connection number might change:Connection 4 is created. Deploy Message Connection 4 is closed.
List all the files from the SI Cluster 1 terminal:
fs ls RAM:/
The stream deployment data can be shown as below:
11085ddc-bc10-11ed-9a44-7ef9696e0000.csd 11085ddc-bc10-11ed-9a44-7ef9696e0001.csd 11085ddc-bc10-11ed-9a44-7ef9696e0002.csd 11085ddc-bc10-11ed-9a44-7ef9696e0003.csd 22085ddc-bc10-11ed-9a44-7ef9696e0000.csd 22085ddc-bc10-11ed-9a44-7ef9696e0001.csd
Start
cam-app-examplefrom the DomU1 terminal to create an application with four streams. Each stream sends an event message 10 times with a period of 3000 milliseconds.cam-app-example -u 11085ddc-bc10-11ed-9a44-7ef9696e -t 3000 -c 10 -s 4 -a 192.168.1.1
The following configure messages are expected from the Primary Compute terminal:
Cam application configuration:
    Service IP address: 192.168.1.1
    Service port: 21604
    UUID base: 11085ddc-bc10-11ed-9a44-7ef9696e
    Stream count: 4
    Processing period (ms): 3000
    Processing count: 10
    Multiple connection support: false
    Calibration mode support: false
    Fault injection support: false
    Event(s) interval time (ms): 0
Using libcam v1.0
Starting activity...
Starting activity...
Starting activity...
Starting activity...
And the log of sent event messages are shown repeatedly:
Stream 0 sends event 0
Stream 1 sends event 0
Stream 2 sends event 0
Stream 3 sends event 0
Stream 0 sends event 0
Stream 1 sends event 0
Stream 2 sends event 0
Stream 3 sends event 0
...
While
cam-app-exampleis running on DomU1, start another instance on DomU2.cam-app-examplehas a mode to inject a fault to test the CAM framework. Runcam-app-exampleagain from the DomU2 terminal with fault injection to event stream 0:cam-app-example -u 22085ddc-bc10-11ed-9a44-7ef9696e -t 2000 -c 5 -s 2 -f -S 0 -T 1000 -a 192.168.1.1
The following configure messages are expected from the Primary Compute terminal:
Cam application configuration: Service IP address: 192.168.1.1 Service port: 21604 UUID base: 22085ddc-bc10-11ed-9a44-7ef9696e Stream count: 2 Processing period (ms): 2000 Processing count: 5 Multiple connection support: false Calibration mode support: false Fault injection support: true Fault injection time: 1000 Fault injection stream: 0 Event(s) interval time (ms): 0 Using libcam v1.0 Starting activity... Starting activity...And the log of sent event messages are shown repeatedly:
Stream 0 sends event 0 Stream 1 sends event 0 Stream 1 sends event 0 Stream 1 sends event 0 ... As observed from the SI Cluster 1 terminal, ``cam-service`` is loading four stream deployment files from DomU1 and two stream deployment files from DomU2 for monitoring. In the following log, the stream messages are received and processed by it: .. code-block:: text Connection 4 is created. Init Message Stream 11085ddc-bc10-11ed-9a44-7ef9696e0002 configuration is loaded. Init Message Stream 11085ddc-bc10-11ed-9a44-7ef9696e0001 configuration is loaded. Init Message Stream 11085ddc-bc10-11ed-9a44-7ef9696e0003 configuration is loaded. Init Message Stream 11085ddc-bc10-11ed-9a44-7ef9696e0000 configuration is loaded. Start Message Start Message Start Message Start Message Event Message Event Message Event Message Event Message Connection 5 is created. Init Message Stream 22085ddc-bc10-11ed-9a44-7ef9696e0001 configuration is loaded. Init Message Stream 22085ddc-bc10-11ed-9a44-7ef9696e0000 configuration is loaded. Start Message Start Message Event Message Event Message Event Message # Repeated event messages ... The fault happens 1000ms after stream initialization. At that time ``cam-service`` should detect a stream temporal error with the following output from the SI Cluster 1 terminal. .. code-block:: text # Repeated event messages ... ERROR: Stream temporal error: ERROR: stream_name: CAM STREAM 0 ERROR: stream_uuid: 2285ddc-bc10-11ed-9a44-7ef9696e0000 ERROR: event_id: 0 ERROR: time_received: 0 ERROR: time_expected: 1710275907816057 # Repeated event messages ... ERROR: Stream state error: ERROR: stream_name: CAM STREAM 0 ERROR: stream_uuid: 22085ddc-bc10-11ed-9a44-7ef9696e0000 ERROR: timestamp: 1710275909816069 ERROR: current_state: Failed state ERROR: requested_state: In-progress state
Note
time_received: 0 should be ignored as the time_received is not set
during a fault.
To leave the DomU1 console, type
Ctrl-]and entersend esc.To leave the DomU2 console, type
Ctrl-].To shut down the FVP and terminate the emulation automatically, follow the below steps:
Issue the following command on the Primary Compute terminal.
shutdown now
The below messages indicate the shutdown process is complete.
[  OK  ] Finished System Power Off.
[  OK  ] Reached target System Power Off.
reboot: Power down
Close the tmux pane started for DomU2 by pressing
Ctrl-d.
Automated Validation
To run the configuration menu:
kas menu kronos/Kconfig
To run the validation tests:
Select
Critical Application Monitoring DemoasUse-Case.Select
Virtualizationfrom theReference Software Stack Architecturemenu.Select
Run Automated Validationfrom theRuntime Validation Setupmenu.Select
Build.
The complete test suite takes around 65 minutes to complete. See Integration Tests Validating the Critical Application Monitoring Demo for more details.
The following messages are expected in the output to validate this Use-Case:
RESULTS - test_40_cam.CAMServiceTest.test_cam_service_boot_on_si: PASSED (0.00s)
RESULTS - test_40_cam.CAMTest.test_cam_app_example_to_service_on_si: PASSED (63.55s)
RESULTS - test_40_cam.CAMTest.test_cam_app_example_to_service_on_si_with_multiple_connections: PASSED (62.12s)
RESULTS - test_40_cam.CAMTest.test_cam_ptp_sync: PASSED (143.39s)
RESULTS - test_40_cam.CAMTest.test_cam_tool_deploy_to_si: PASSED (63.58s)
RESULTS - test_40_cam.CAMTest.test_cam_tool_pack: PASSED (62.96s)
RESULTS - test_40_cam.CAMTest.test_data_calibration: PASSED (175.01s)
RESULTS - test_40_cam.CAMTest.test_logical_check_on_si: PASSED (26.43s)
RESULTS - test_40_cam.CAMTest.test_temporal_check_on_si: PASSED (78.28s)
RESULTS - test_40_cam.CAMTestDomU2.test_cam_app_example_to_service_on_si: PASSED (60.84s)
RESULTS - test_40_cam.CAMTestDomU2.test_cam_app_example_to_service_on_si_with_multiple_connections: PASSED (63.07s)
RESULTS - test_40_cam.CAMTestDomU2.test_cam_ptp_sync: PASSED (13.27s)
RESULTS - test_40_cam.CAMTestDomU2.test_cam_tool_deploy_to_si: PASSED (32.96s)
RESULTS - test_40_cam.CAMTestDomU2.test_cam_tool_pack: PASSED (32.19s)
RESULTS - test_40_cam.CAMTestDomU2.test_data_calibration: PASSED (100.73s)
RESULTS - test_40_cam.CAMTestDomU2.test_logical_check_on_si: PASSED (25.67s)
RESULTS - test_40_cam.CAMTestDomU2.test_temporal_check_on_si: PASSED (77.41s)
RESULTS - test_40_cam.CAMTestMultiDom.test_cam_app_example_to_service_on_si_with_multiple_vms: PASSED (68.86s)
Note
There is a rare known failure where a timeout might occur during test execution. Refer to Known Issues for possible workarounds.
Safety Island Actuation Demo
The demo can be run on the Baremetal Architecture or Virtualization Architecture. See Safety Island Actuation Demo for further details.
Baremetal Architecture
Build
To run the configuration menu:
kas menu kronos/Kconfig
To build a Baremetal Architecture image:
Select
Safety Island Actuation Demofrom theUse-Casemenu.Select
Baremetalfrom theReference Software Stack Architecturemenu.Select
Build.
Run the FVP
To start the FVP and connect to the Primary Compute terminal (running Linux):
kas shell -c "../layers/meta-arm/scripts/runfvp -t tmux --verbose"
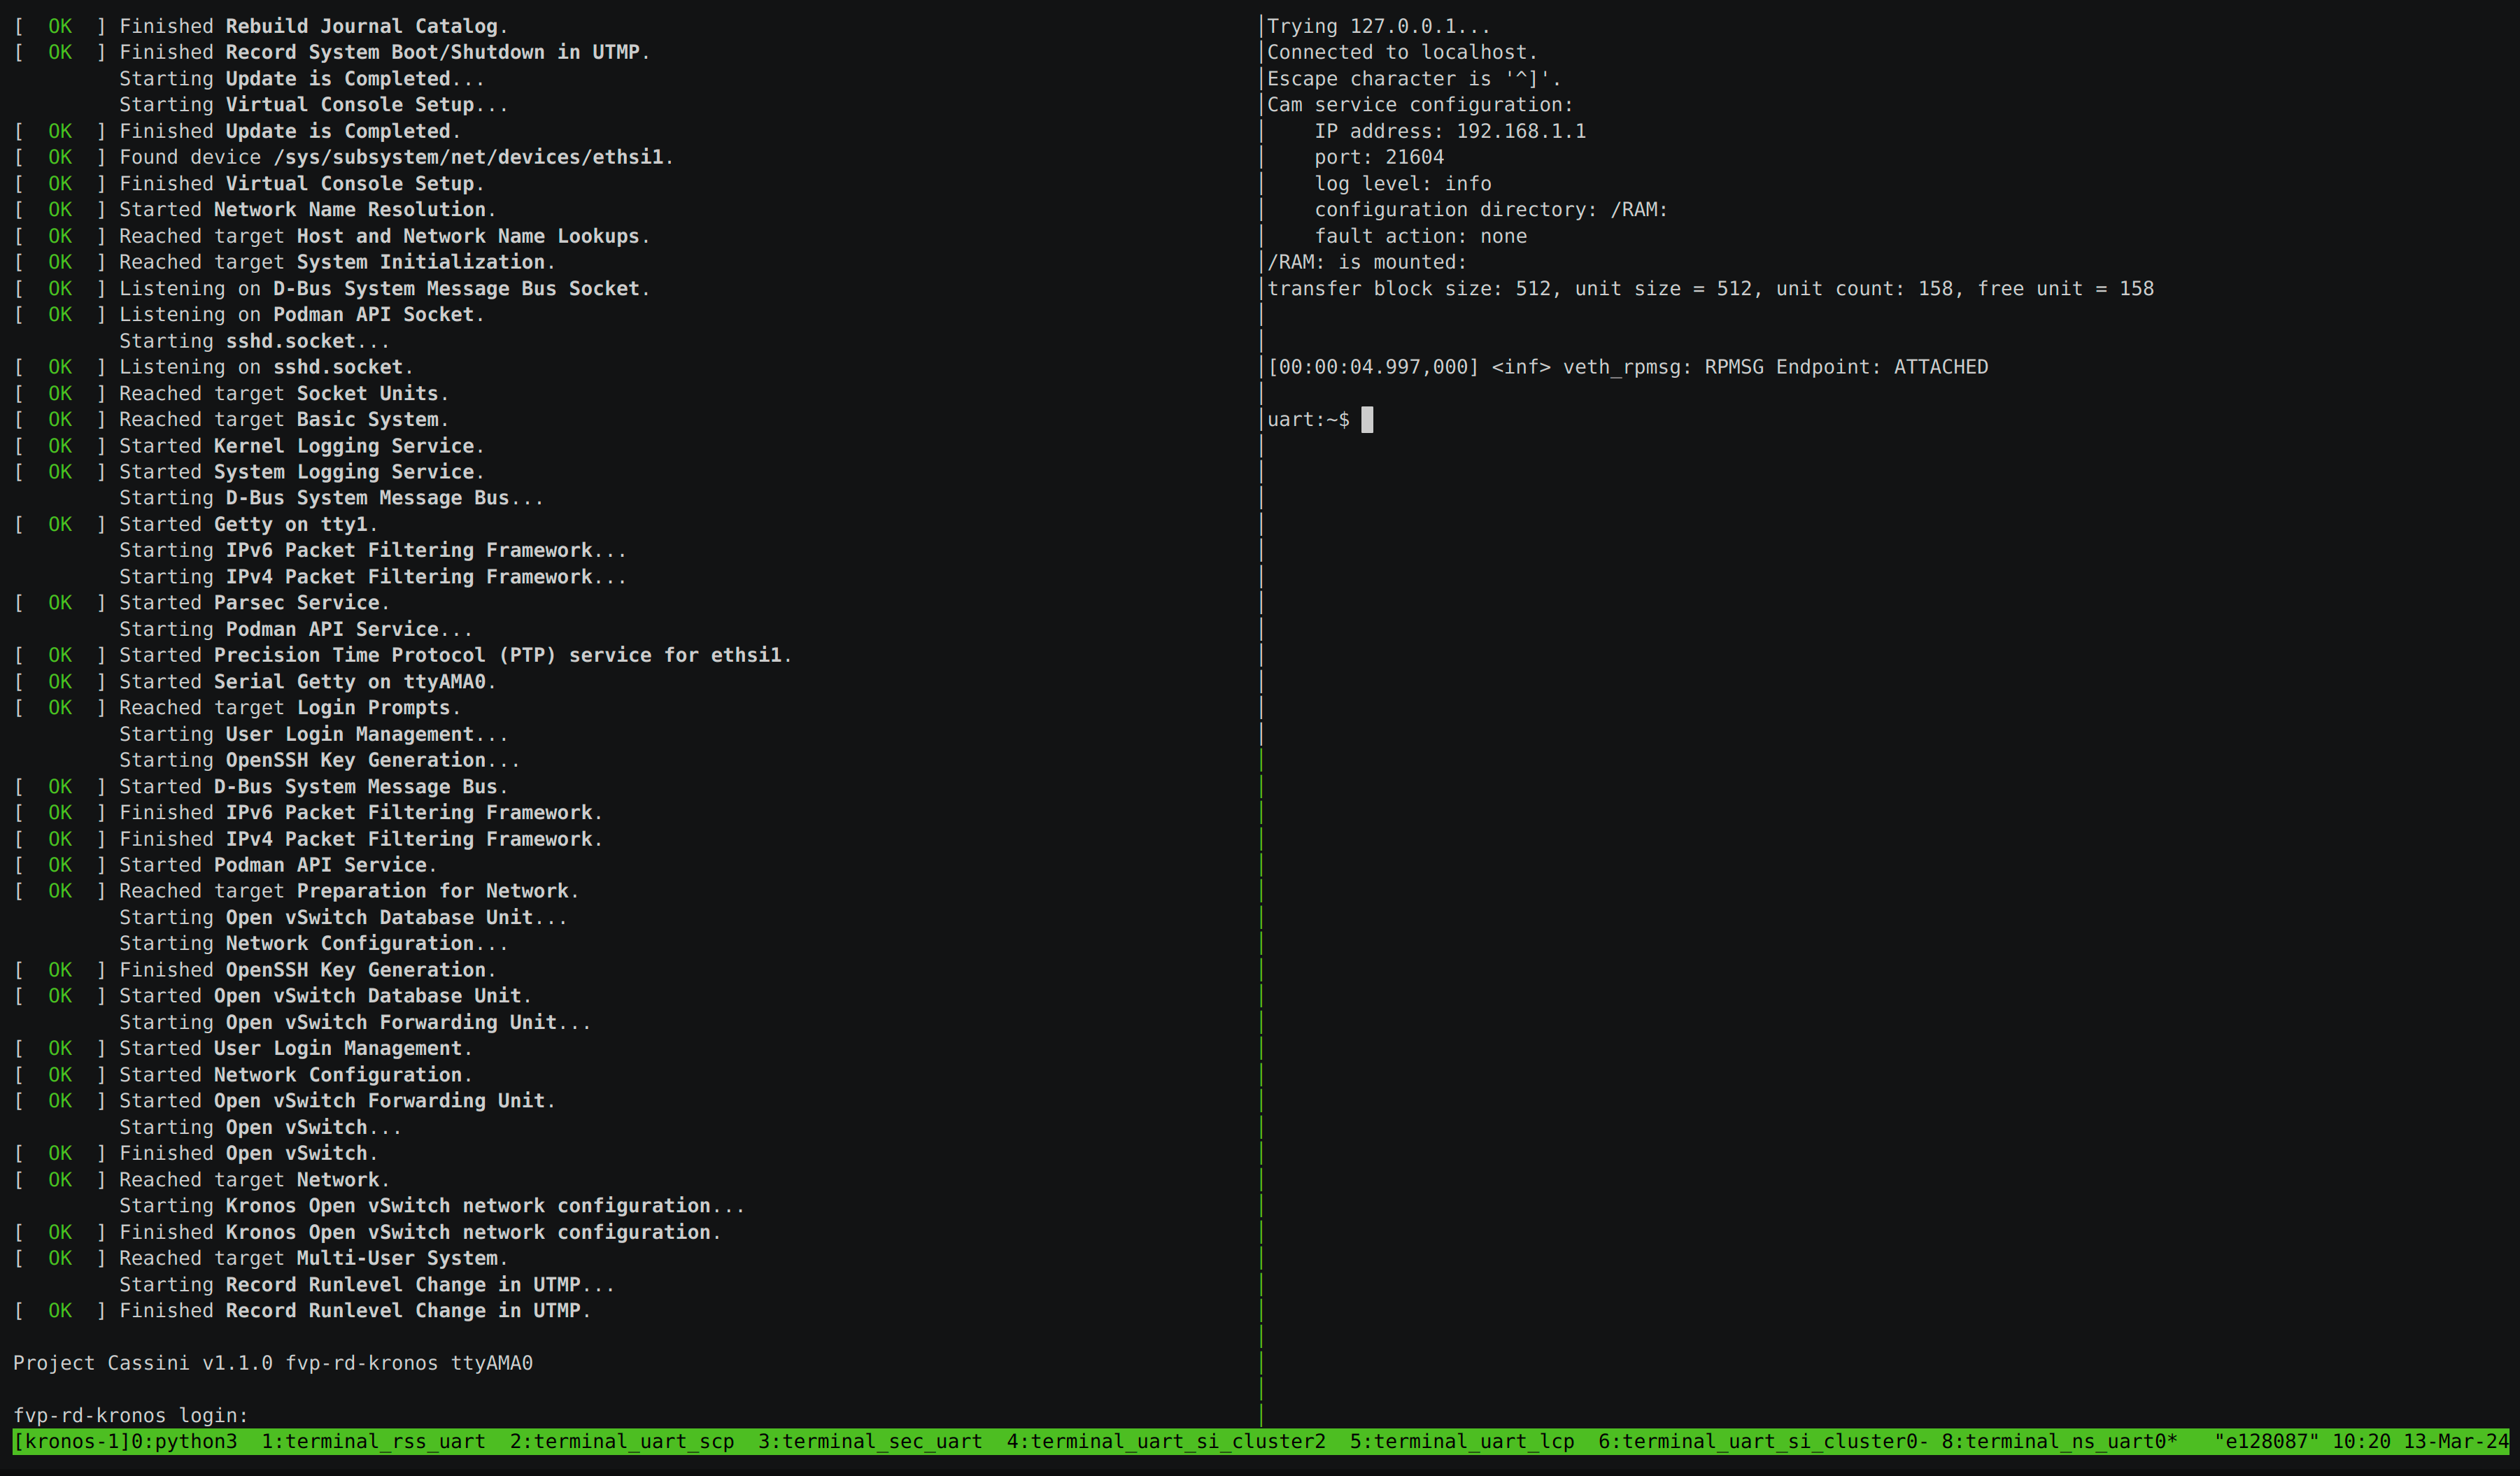
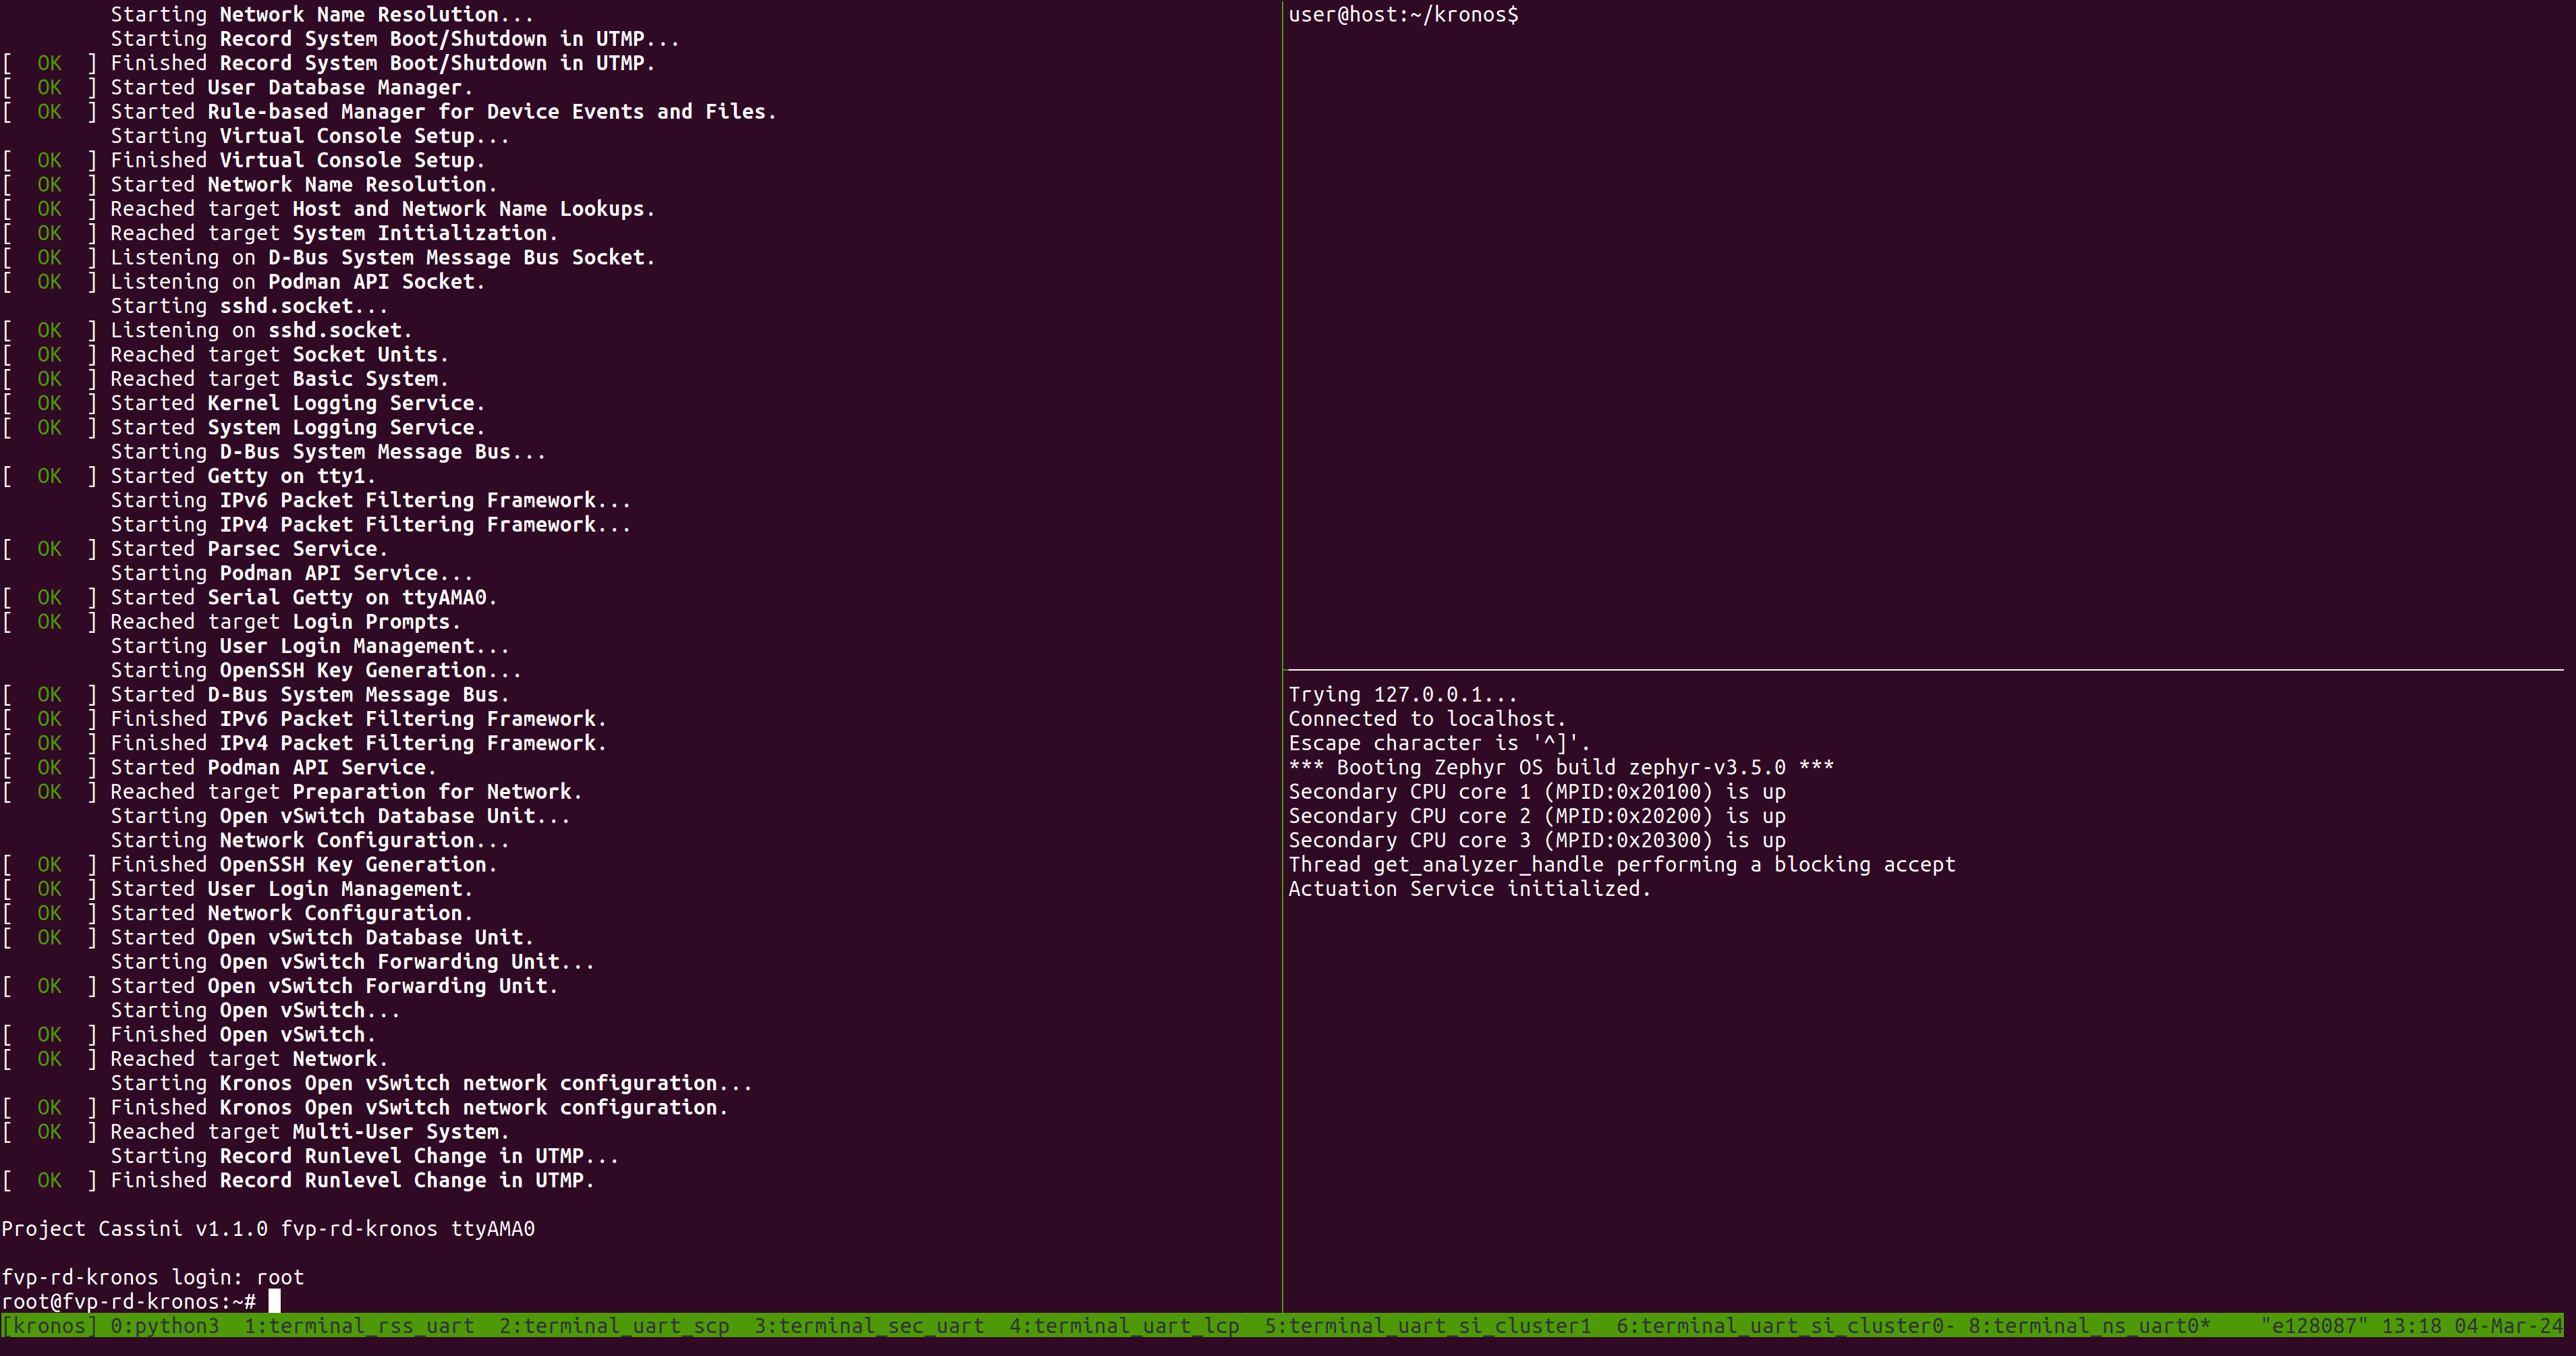
The user should wait for the system to boot and for the Linux prompt to appear. The following image shows an example on how the terminal should look after the fvp invocation.
The Safety Island (SI) Cluster 2 terminal running the Actuation Service is
available via the tmux window titled terminal_uart_si_cluster2. For ease of
navigation, it’s recommended to join the SI Cluster 2 terminal window to the
Primary Compute terminal window and creating a tmux pane attached to the build
host machine in order to issue commands on it.
Follow the steps below to achieve the same:
Ensure that the tmux window titled
terminal_ns_uart0is selected. If not, pressCtrl-b wfrom the tmux session, navigate to the tmux window titledterminal_ns_uart0using the arrow keys, then press theEnterkey.Press
Ctrl-b %to add a new tmux pane which will be used to issue commands on the build host machine.Press
Ctrl-b :and then typejoin-pane -s :terminal_uart_si_cluster2followed by pressingEnterkey to join the Actuation Service terminal window to the Primary Compute terminal window.
Refer to the following image of the tmux panes rearrangement. Panes can
be navigated using Ctrl-b followed by the arrow keys.
The Reference Software Stack running on the Primary Compute can be logged into
as root user without a password in the Linux terminal. Run the below
command to guarantee that all the expected services have been
initialized.
systemctl is-system-running --wait
Wait for it to return. The expected terminal output is running.
Run the Demo
Run the
pingcommand from the Primary Compute terminal (running Linux) to verify that it can communicate with the Safety Island Cluster 2 (running Zephyr):ping 192.168.2.1 -c 10
The output should look like the following line, repeated 10 times:
64 bytes from 192.168.2.1 seq=0 ttl=64 time=0.151 ms
From the tmux pane started for the build host machine terminal, start the Packet Analyzer:
cd ~/kronos/ kas shell -c "oe-run-native packet-analyzer-native start_analyzer -L debug -a localhost -c ./data"
The following messages are expected from the host terminal:
INFO : analyzer_client.py/_connect_to: Starting analyze, use Ctrl-C to stop the process. INFO : analyzer_client.py/_connect_to: Attempting a connect to (localhost : 49152) INFO : analyzer_client.py/_connect_to: Successfully connected to (localhost : 49152)
A message similar to the following should appear on the SI Cluster 2 terminal:
Actuation Service initialized. Accepted tcp connection from the Packet Analyzer: <11>
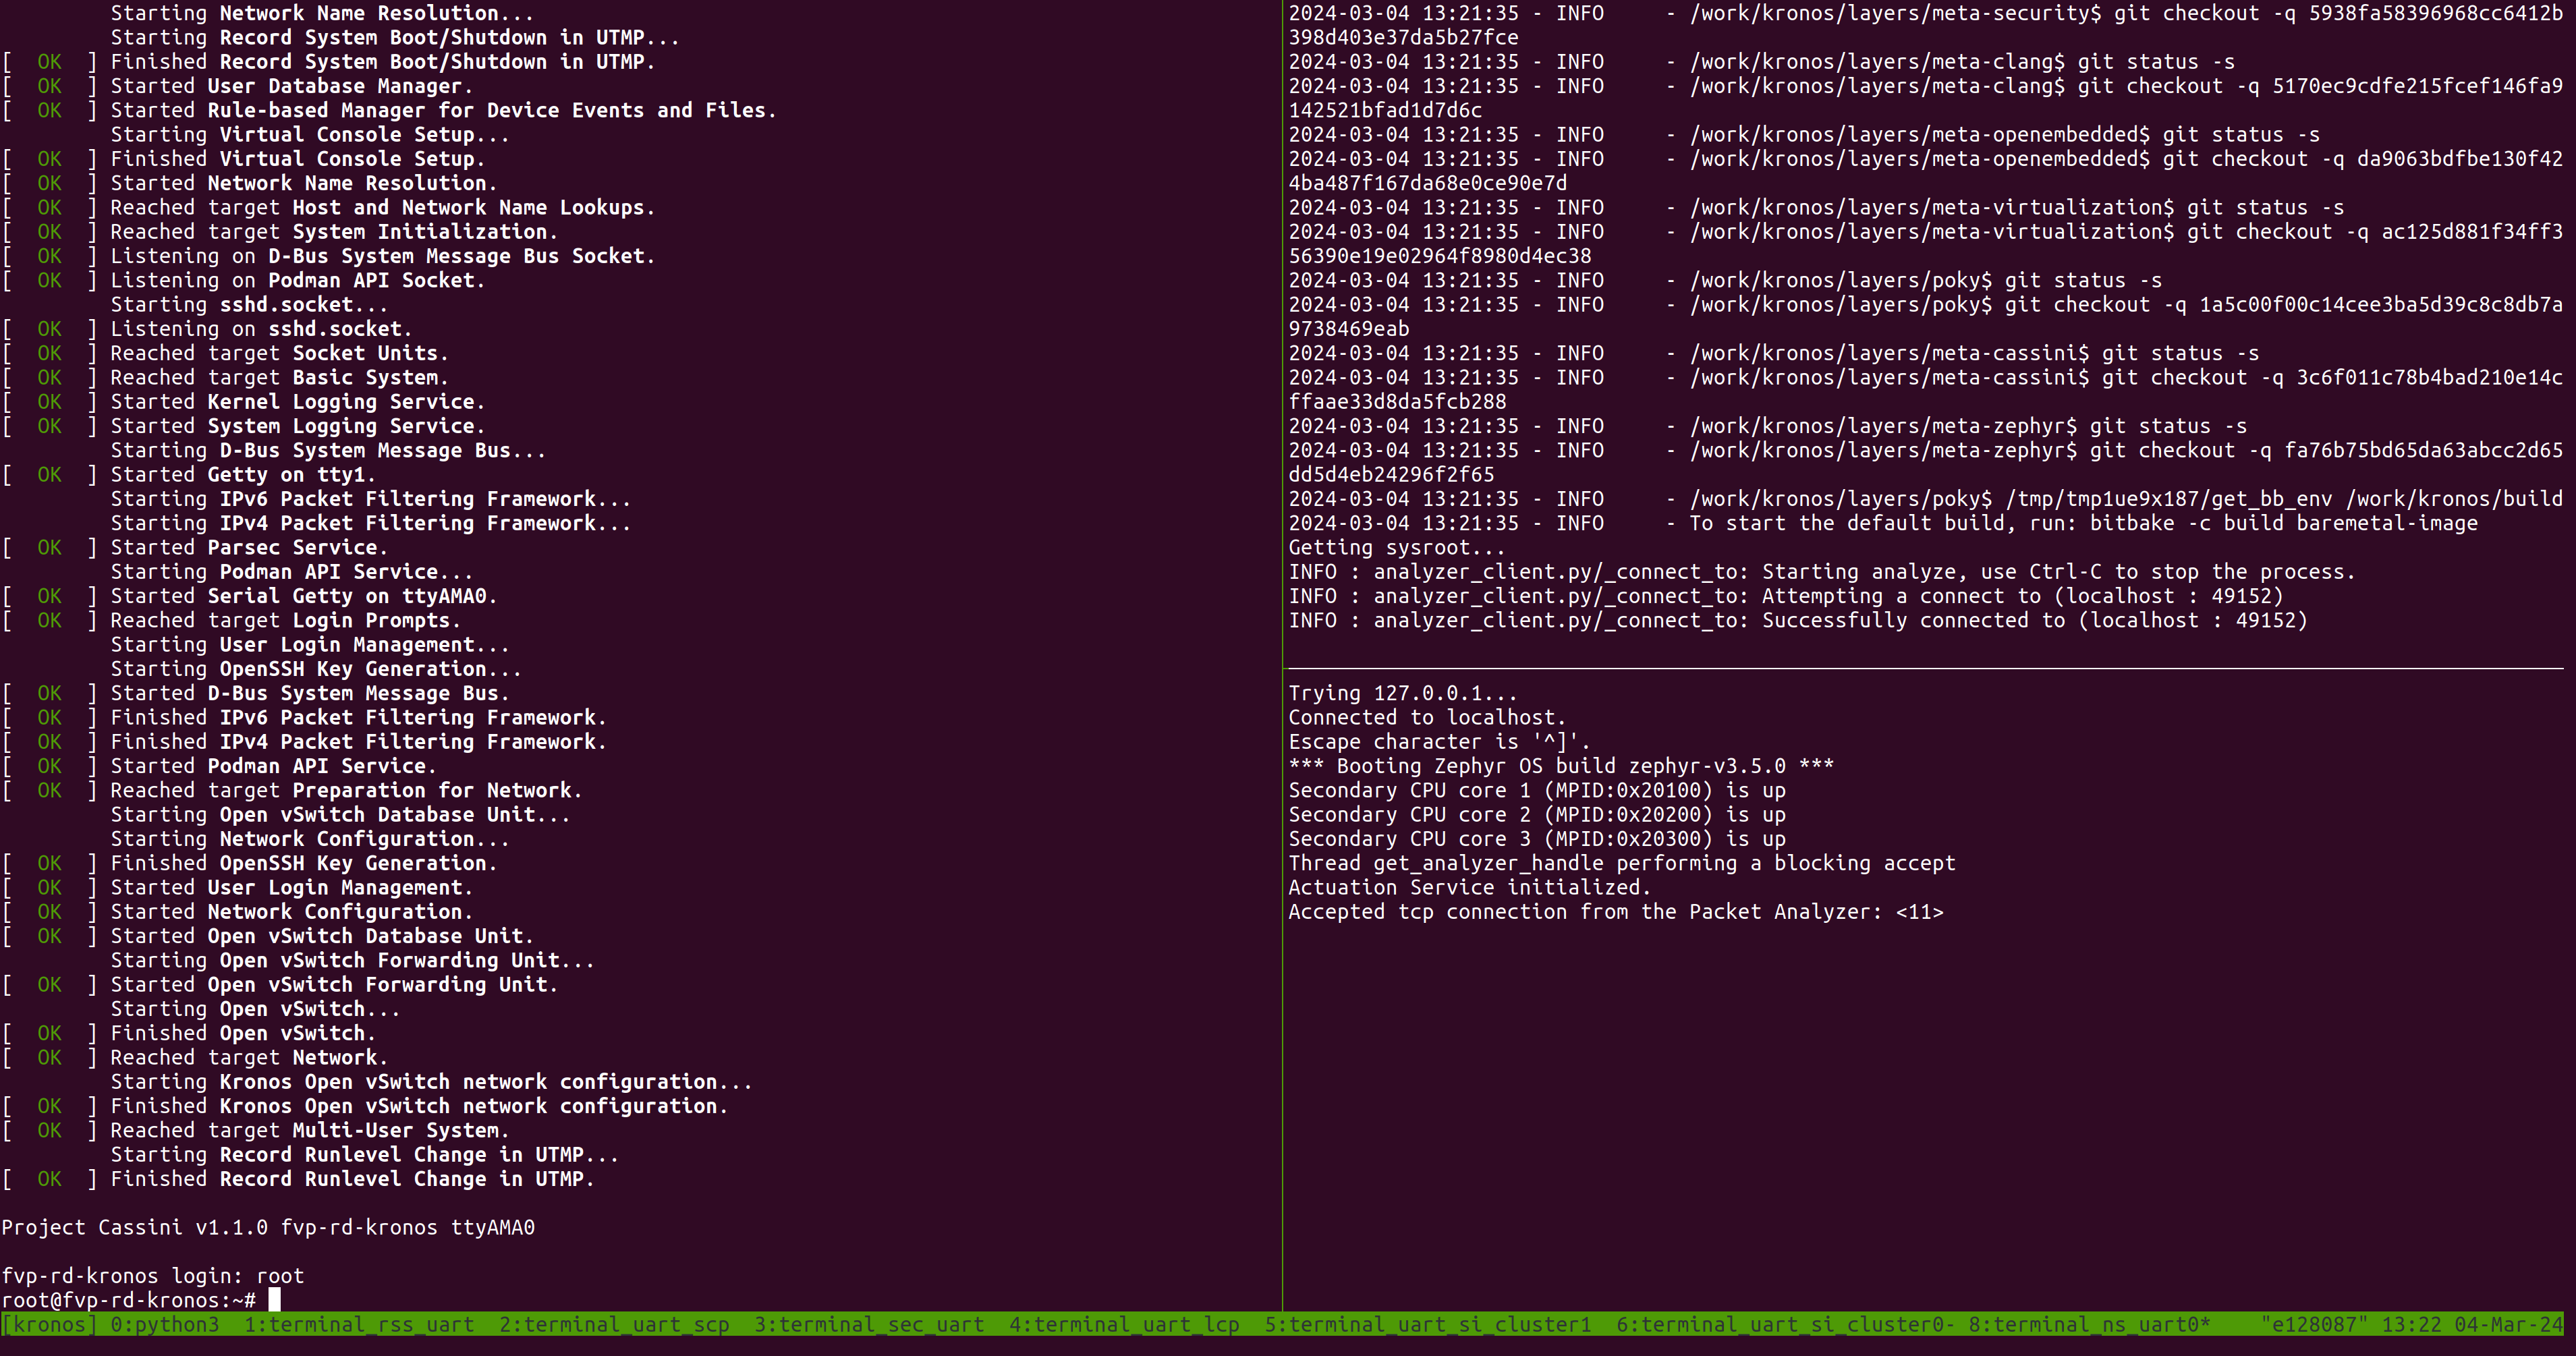
Refer to the following image for an invocation example of the Packet Analyzer.
Start the Player on the Primary Compute terminal which replays a recording of a driving scenario:
actuation_player -p /usr/share/actuation_player/
A message similar to the following should appear on the Primary Compute terminal:
A message similar to the following should appear on the SI Cluster 2 terminal:
51572682601: -0.0000 (m/s^2) | 0.0000 (rad) 51597466928: -0.0000 (m/s^2) | 0.0000 (rad) 51622532911: -0.0000 (m/s^2) | 0.0000 (rad) 51647642316: -0.0000 (m/s^2) | 0.0000 (rad) 51672535849: -0.0000 (m/s^2) | 0.0000 (rad) 51697376579: -0.0000 (m/s^2) | 0.0000 (rad) 51722500414: -0.0000 (m/s^2) | 0.0000 (rad) 51747622543: -0.0000 (m/s^2) | 0.0000 (rad) 51772496466: -0.0000 (m/s^2) | 0.0000 (rad) Thread get_analyzer_handle performing a blocking accept
A message similar to the following should appear on the host terminal where the Packet Analyzer is running:
INFO : analyzer_client.py/_connect_to: Starting analyze, use Ctrl-C to stop the process. INFO : analyzer_client.py/_connect_to: Attempting a connect to (localhost : 49152) INFO : analyzer_client.py/_connect_to: Successfully connected to (localhost : 49152) INFO : analyzer_client.py/run_analyze_on_chain: (1) Analyzer synced with packet chain
The following messages should appear, but values may differ once the Packet Analyzer has finished running:
INFO : analyzer_client.py/run_analyze_on_chain: All expected control packets received INFO : analyzer_client.py/_log_jitter: Observed Frequency = 21.36147200, Avg Jitter = 0.02624593, Std Deviation:0.06096328 INFO : analyzer_client.py/run_analyze_on_chain: End of cycle: AnalyzerResult.SUCCESS INFO : analyzer_client.py/_tear_conn: Received fin ack from Actuation Service Chain ID Result 0 AnalyzerResult.SUCCESS
To shut down the FVP and terminate the emulation automatically, follow the below steps:
Issue the following command on the Primary Compute terminal.
shutdown now
The below messages indicate the shutdown process is complete.
[  OK  ] Finished System Power Off.
[  OK  ] Reached target System Power Off.
reboot: Power down
Close the tmux pane started for the build host machine by pressing
Ctrl-d.
Automated Validation
To run the configuration menu:
kas menu kronos/Kconfig
To run the validation tests:
Select
Safety Island Actuation DemoasUse-Case.Select
Baremetalfrom theReference Software Stack Architecturemenu.Select
Run Automated Validationfrom theRuntime Validation Setupmenu.Select
Build.
The complete test suite takes around 45 minutes to complete. See Integration Tests Validating the Safety Island Actuation Demo for more details.
The following messages are expected in the output to validate this Use-Case:
RESULTS - test_30_actuation.ActuationTest.test_analyzer_help: PASSED (0.44s)
RESULTS - test_30_actuation.ActuationTest.test_ping: PASSED (26.04s)
RESULTS - test_30_actuation.ActuationTest.test_player_to_analyzer: PASSED (167.15s)
Note
There is a rare known failure where a timeout might occur during test execution. Refer to Known Issues for possible workarounds.
Virtualization Architecture
Build
To run the configuration menu:
kas menu kronos/Kconfig
To build a Virtualization Architecture image:
Select
Safety Island Actuation Demofrom theUse-Casemenu.Select
Virtualizationfrom theReference Software Stack Architecturemenu.Select
Build.
Run the FVP
To start the FVP and connect to the Primary Compute terminal (running Linux):
kas shell -c "../layers/meta-arm/scripts/runfvp -t tmux --verbose"
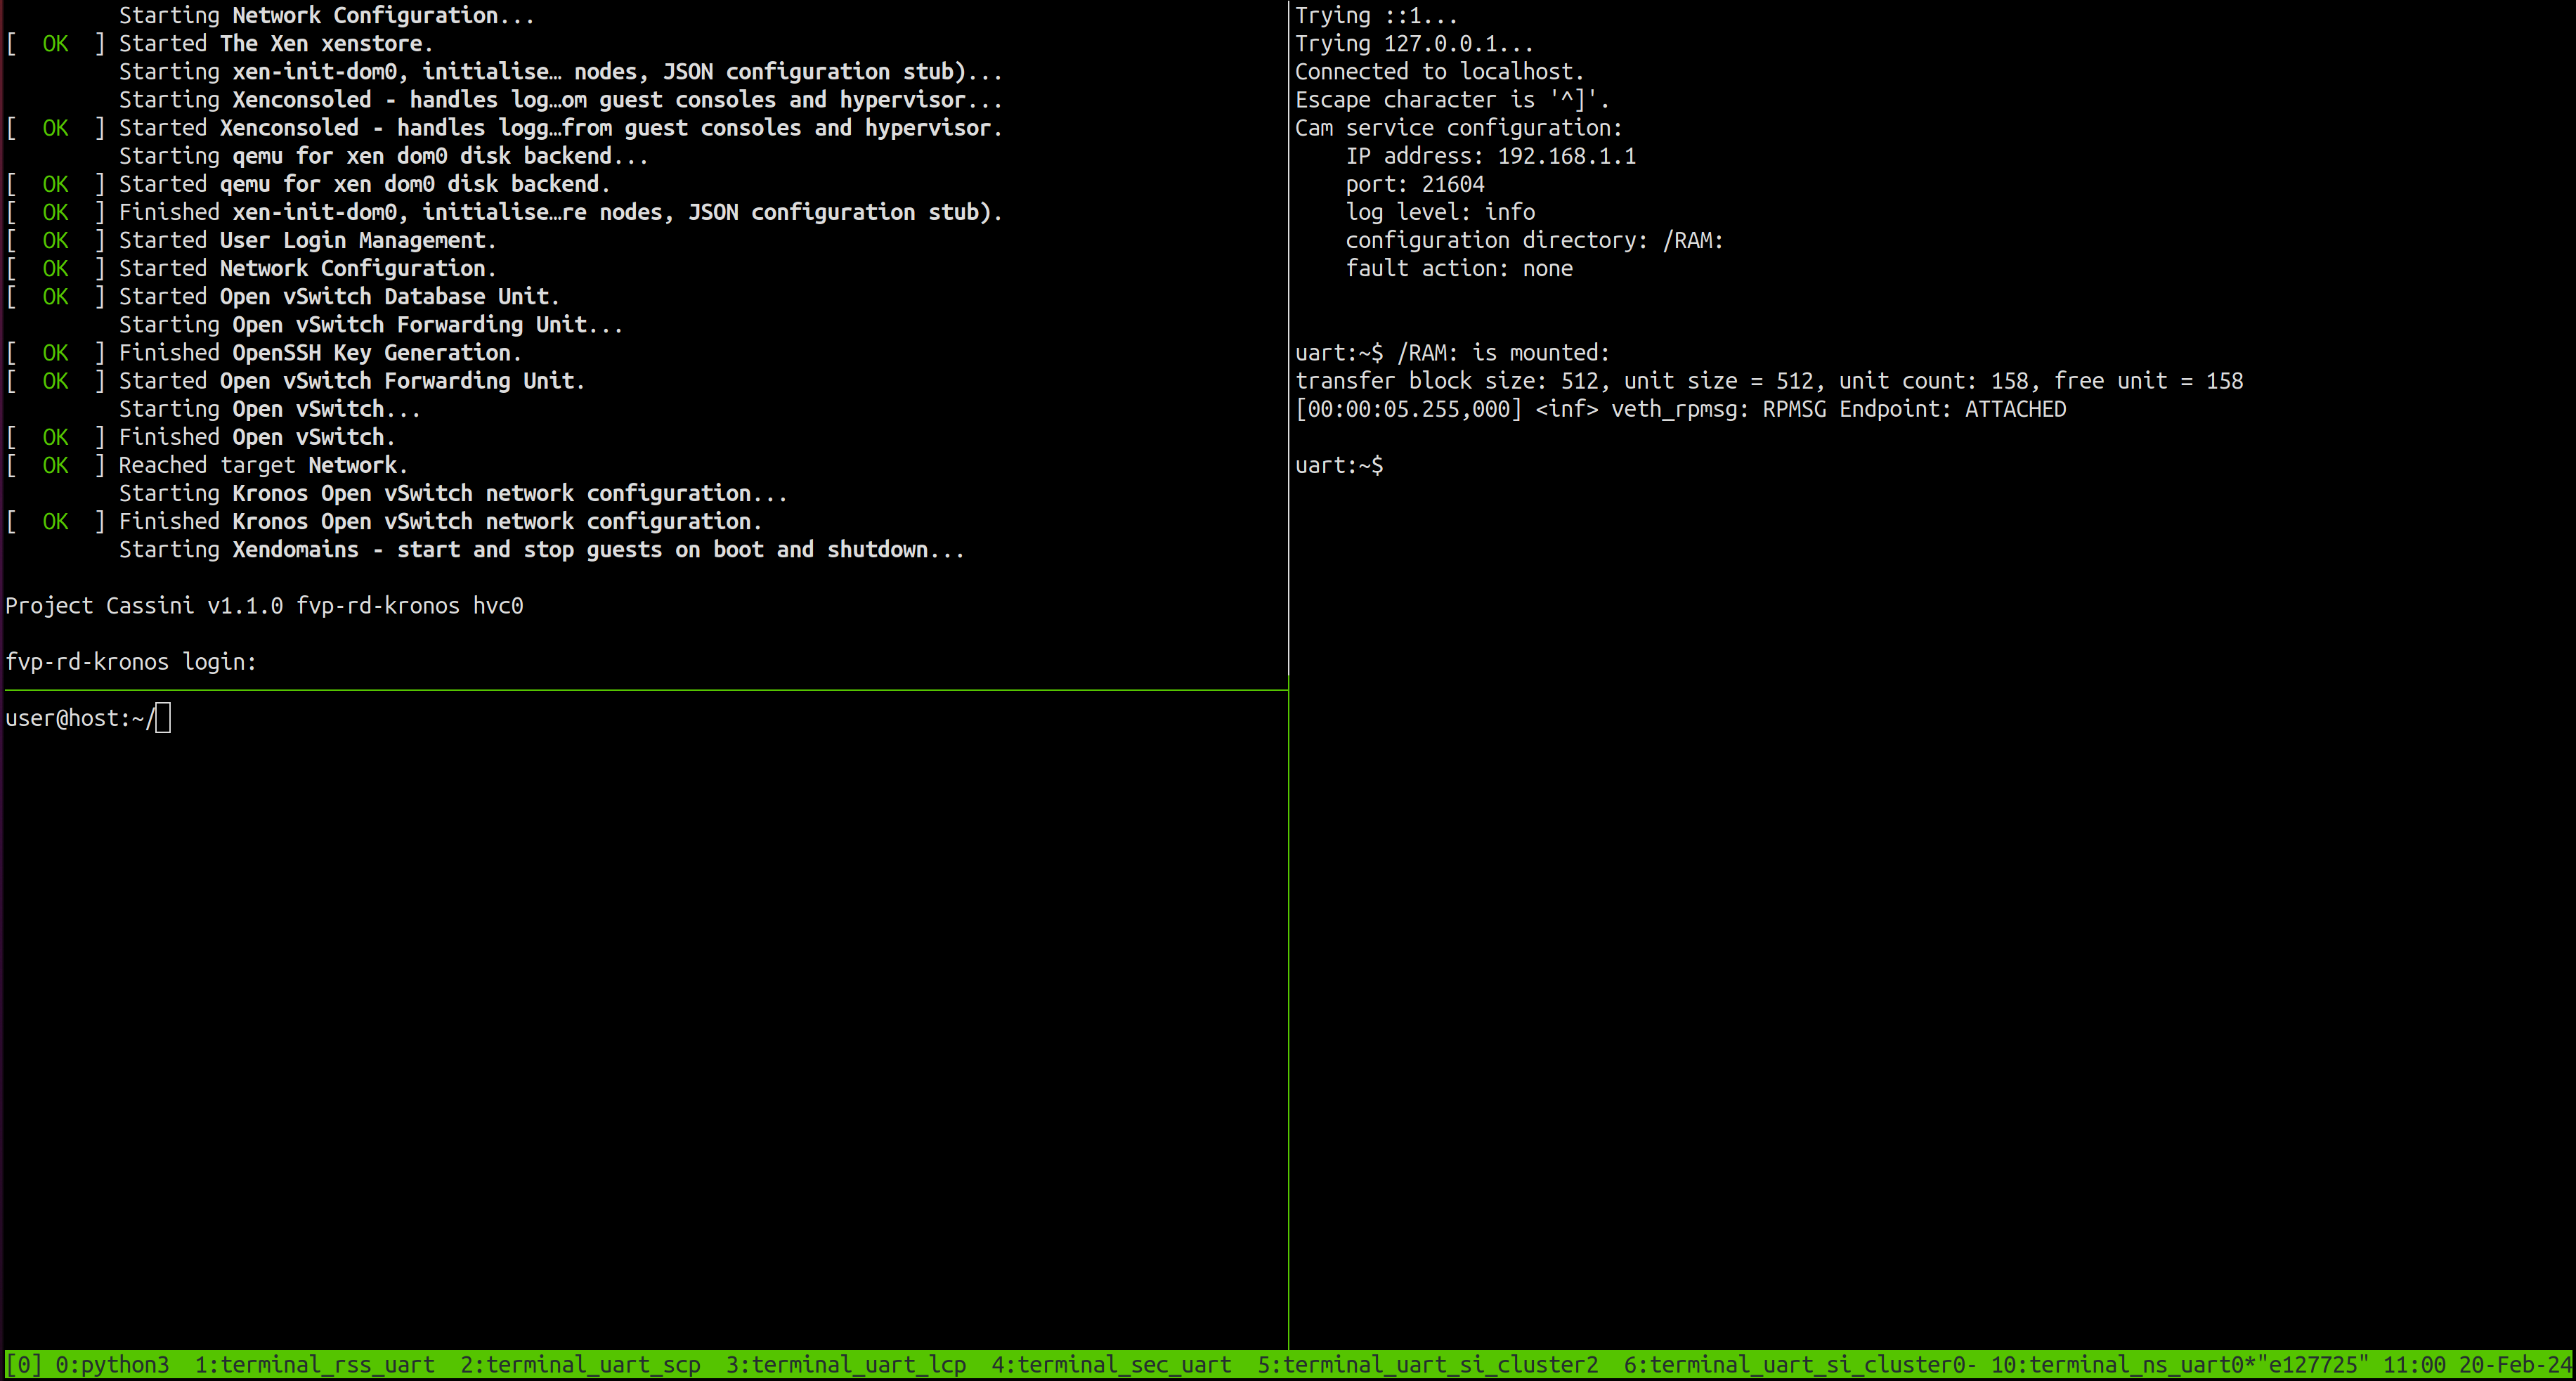
The user should wait for the system to boot and for the Linux prompt to appear. On a Virtualization Architecture image, this will access the Dom0 terminal. The following image shows an example on how the terminal should look after the fvp invocation.
The Safety Island (SI) Cluster 2 terminal running the Actuation Service is
available via the tmux window titled terminal_uart_si_cluster2. For ease of
navigation, it’s recommended to join the SI Cluster 2 terminal window to the
Primary Compute terminal window and creating a tmux pane attached to the build
host machine in order to issue commands on it.
Follow the steps below to achieve the same:
Ensure that the tmux window titled
terminal_ns_uart0is selected. If not, pressCtrl-b wfrom the tmux session, navigate to the tmux window titledterminal_ns_uart0using the arrow keys, then press theEnterkey.Press
Ctrl-b %to add a new tmux pane which will be used to issue commands on the build host machine.Press
Ctrl-b :and then typejoin-pane -s :terminal_uart_si_cluster2followed by pressingEnterkey to join the Actuation Service terminal window to the Primary Compute terminal window.
Refer to the following image of the tmux panes rearrangement. Panes can
be navigated using Ctrl-b followed by the arrow keys.
The Reference Software Stack running on the Primary Compute can be logged into
as root user without a password in the Linux terminal. Run the below
command to guarantee that all the expected services have been
initialized.
systemctl is-system-running --wait
Wait for it to return. The expected terminal output is running.
Note
A message similar to the following might appear in the Primary Compute
terminal (XEN) d2v0: vGICR: SGI: unhandled word write 0x000000ffffffff
to ICACTIVER0, this is an expected behavior.
Run the Demo
Enter the DomU1 console using the
xltool:xl console domu1
DomU1 can be logged into as
rootuser without a password in the Linux terminal. This command will provide a console on the DomU1. To exit, enterCtrl-](to access the FVP telnet shell), followed by typingsend escinto the telnet shell and pressingEnter. See the xl documentation for further details.Run the
pingcommand from the DomU1 terminal (running Linux) to verify that it can communicate with the Safety Island Cluster 2 (running Zephyr):ping 192.168.2.1 -c 10
The output should look like the following line, repeated 10 times:
64 bytes from 192.168.2.1 seq=0 ttl=64 time=0.151 ms
From the tmux pane started for the build host machine terminal, start the Packet Analyzer:
cd ~/kronos/
kas shell -c "oe-run-native packet-analyzer-native start_analyzer -L debug -a localhost -c ./data"
The following messages are expected from the host terminal:
INFO : analyzer_client.py/_connect_to: Starting analyze, use Ctrl-C to stop the process.
INFO : analyzer_client.py/_connect_to: Attempting a connect to (localhost : 49152)
INFO : analyzer_client.py/_connect_to: Successfully connected to (localhost : 49152)
A message similar to the following should appear on the SI Cluster 2 terminal:
Actuation Service initialized.
Accepted tcp connection from the Packet Analyzer: <11>
Refer to the following image for an invocation example of the Packet Analyzer.
Start the Player on DomU1 which replays a recording of a driving scenario:
actuation_player -p /usr/share/actuation_player/
A message similar to the following should appear on the Primary Compute terminal:
A message similar to the following should appear on the SI Cluster 2 terminal:
51572682601: -0.0000 (m/s^2) |  0.0000 (rad)
51597466928: -0.0000 (m/s^2) |  0.0000 (rad)
51622532911: -0.0000 (m/s^2) |  0.0000 (rad)
51647642316: -0.0000 (m/s^2) |  0.0000 (rad)
51672535849: -0.0000 (m/s^2) |  0.0000 (rad)
51697376579: -0.0000 (m/s^2) |  0.0000 (rad)
51722500414: -0.0000 (m/s^2) |  0.0000 (rad)
51747622543: -0.0000 (m/s^2) |  0.0000 (rad)
51772496466: -0.0000 (m/s^2) |  0.0000 (rad)
Thread get_analyzer_handle performing a blocking accept
A message similar to the following should appear on the host terminal where the Packet Analyzer is running:
INFO : analyzer_client.py/_connect_to: Starting analyze, use Ctrl-C to stop the process.
INFO : analyzer_client.py/_connect_to: Attempting a connect to (localhost : 49152)
INFO : analyzer_client.py/_connect_to: Successfully connected to (localhost : 49152)
INFO : analyzer_client.py/run_analyze_on_chain: (1) Analyzer synced with packet chain
The following messages should appear, but values may differ once the Packet Analyzer has finished running:
INFO : analyzer_client.py/run_analyze_on_chain: All expected control packets received
INFO : analyzer_client.py/_log_jitter: Observed Frequency = 21.36147200, Avg Jitter = 0.02624593, Std Deviation:0.06096328
INFO : analyzer_client.py/run_analyze_on_chain: End of cycle: AnalyzerResult.SUCCESS

INFO : analyzer_client.py/_tear_conn: Received fin ack from Actuation Service

Chain ID   Result
0          AnalyzerResult.SUCCESS
To leave the DomU1 console, type
Ctrl-]and entersend esc.To shut down the FVP and terminate the emulation automatically, follow the below steps:
Issue the following command on the Primary Compute terminal.
shutdown now
The below messages indicate the shutdown process is complete.
[  OK  ] Finished System Power Off.
[  OK  ] Reached target System Power Off.
reboot: Power down
Close the tmux pane started for the build host machine by pressing
Ctrl-d.
Automated Validation
To run the configuration menu:
kas menu kronos/Kconfig
To run the validation tests:
Select
Safety Island Actuation DemoasUse-Case.Select
Virtualizationfrom theReference Software Stack Architecturemenu.Select
Run Automated Validationfrom theRuntime Validation Setupmenu.Select
Build.
The complete test suite takes around 110 minutes to complete. See Integration Tests Validating the Safety Island Actuation Demo for more details.
The following messages are expected in the output to validate this Use-Case:
RESULTS - test_30_actuation.ActuationTest.test_analyzer_help: PASSED (0.40s)
RESULTS - test_30_actuation.ActuationTest.test_ping: PASSED (42.15s)
RESULTS - test_30_actuation.ActuationTest.test_player_to_analyzer: PASSED (265.77s)
Note
There is a rare known failure where a timeout might occur during test execution. Refer to Known Issues for possible workarounds.
Safety Island Communication Demo (using HIPC)
The Safety Island Communication Demo uses HIPC (Heterogeneous Inter-processor Communication) to validate networking between the Primary Compute and the three Safety Island clusters.
Baremetal Architecture
Build
To run the configuration menu:
kas menu kronos/Kconfig
To build a Baremetal Architecture image:
Select
Safety Island Communication Demo (using HIPC)from theUse-Casemenu.Select
Baremetalfrom theReference Software Stack Architecturemenu.Select
Build.
Automated Validation
To run the configuration menu:
kas menu kronos/Kconfig
To run the validation tests:
Select
Safety Island Communication Demo (using HIPC)asUse-Case.Select
Baremetalfrom theReference Software Stack Architecturemenu.Select
Run Automated Validationfrom theRuntime Validation Setupmenu.Select
Build.
The complete test suite takes around 45 minutes to complete. See Integration Tests Validating the Safety Island Communication Demo for more details.
The following messages are expected in the output to validate this Use-Case:
RESULTS - test_30_hipc.HIPCTestBase.test_hipc_cluster0: PASSED (223.04s)
RESULTS - test_30_hipc.HIPCTestBase.test_hipc_cluster1: PASSED (351.62s)
RESULTS - test_30_hipc.HIPCTestBase.test_hipc_cluster2: PASSED (426.17s)
RESULTS - test_30_hipc.HIPCTestBase.test_hipc_cluster_cl0_cl1: PASSED (100.46s)
RESULTS - test_30_hipc.HIPCTestBase.test_hipc_cluster_cl0_cl2: PASSED (120.00s)
RESULTS - test_30_hipc.HIPCTestBase.test_hipc_cluster_cl1_cl2: PASSED (161.80s)
RESULTS - test_30_hipc.HIPCTestBase.test_ping_cl0_cl1: PASSED (37.34s)
RESULTS - test_30_hipc.HIPCTestBase.test_ping_cl0_cl2: PASSED (36.80s)
RESULTS - test_30_hipc.HIPCTestBase.test_ping_cl1_cl2: PASSED (37.10s)
RESULTS - test_30_hipc.HIPCTestBase.test_ping_cluster0: PASSED (102.31s)
RESULTS - test_30_hipc.HIPCTestBase.test_ping_cluster1: PASSED (95.50s)
RESULTS - test_30_hipc.HIPCTestBase.test_ping_cluster2: PASSED (92.91s)
RESULTS - test_30_ptp.PTPTest.test_ptp_linux_services: PASSED (4.56s)
RESULTS - test_30_ptp.PTPTest.test_ptp_si_clients: PASSED (34.73s)
Note
There is a rare known failure where a timeout might occur during test execution. Refer to Known Issues for possible workarounds.
Virtualization Architecture
Build
To run the configuration menu:
kas menu kronos/Kconfig
To build a Virtualization Architecture image:
Select
Safety Island Communication Demo (using HIPC)asUse-Case.Select
Virtualizationfrom theReference Software Stack Architecturemenu.Select
Build.
Automated Validation
To run the configuration menu:
kas menu kronos/Kconfig
To run the validation tests:
Select
Safety Island Communication Demo (using HIPC)asUse-Case.Select
Virtualizationfrom theReference Software Stack Architecturemenu.Select
Run Automated Validationfrom theRuntime Validation Setupmenu.Select
Build.
The complete test suite takes around 90 minutes to complete. See Integration Tests Validating the Safety Island Communication Demo for more details.
The following messages are expected in the output to validate this Use-Case:
RESULTS - test_30_hipc_virtualization.HIPCTestDomU1.test_hipc_cluster0: PASSED (311.77s)
RESULTS - test_30_hipc_virtualization.HIPCTestDomU1.test_hipc_cluster1: PASSED (389.55s)
RESULTS - test_30_hipc_virtualization.HIPCTestDomU1.test_hipc_cluster2: PASSED (413.83s)
RESULTS - test_30_hipc_virtualization.HIPCTestDomU1.test_hipc_cluster_cl0_cl1: PASSED (114.97s)
RESULTS - test_30_hipc_virtualization.HIPCTestDomU1.test_hipc_cluster_cl0_cl2: PASSED (138.32s)
RESULTS - test_30_hipc_virtualization.HIPCTestDomU1.test_hipc_cluster_cl1_cl2: PASSED (182.33s)
RESULTS - test_30_hipc_virtualization.HIPCTestDomU1.test_ping_cl0_cl1: PASSED (60.64s)
RESULTS - test_30_hipc_virtualization.HIPCTestDomU1.test_ping_cl0_cl2: PASSED (61.63s)
RESULTS - test_30_hipc_virtualization.HIPCTestDomU1.test_ping_cl1_cl2: PASSED (61.06s)
RESULTS - test_30_hipc_virtualization.HIPCTestDomU1.test_ping_cluster0: PASSED (153.76s)
RESULTS - test_30_hipc_virtualization.HIPCTestDomU1.test_ping_cluster1: PASSED (154.39s)
RESULTS - test_30_hipc_virtualization.HIPCTestDomU1.test_ping_cluster2: PASSED (153.34s)
RESULTS - test_30_hipc_virtualization.HIPCTestDomU2.test_hipc_cluster1: PASSED (365.17s)
RESULTS - test_30_hipc_virtualization.HIPCTestDomU2.test_ping_cluster1: PASSED (152.43s)
RESULTS - test_30_ptp.PTPTest.test_ptp_linux_services: PASSED (7.17s)
RESULTS - test_30_ptp.PTPTest.test_ptp_si_clients: PASSED (47.37s)
RESULTS - test_30_ptp.PTPTestDomU1.test_ptp_domu_client: PASSED (50.57s)
RESULTS - test_30_ptp.PTPTestDomU1.test_ptp_linux_services: PASSED (1.38s)
RESULTS - test_30_ptp.PTPTestDomU2.test_ptp_domu_client: PASSED (50.31s)
RESULTS - test_30_ptp.PTPTestDomU2.test_ptp_linux_services: PASSED (1.48s)
Note
There is a rare known failure where a timeout might occur during test execution. Refer to Known Issues for possible workarounds.
Parsec-enabled TLS Demo
The demo can be run on the Baremetal Architecture. It consists of a TLS server
and a TLS client. Refer to Parsec-enabled TLS Demo
for more information on this application. This demo is included as part of the
Safety Island Actuation Demo.
Baremetal Architecture
Build
To run the configuration menu:
kas menu kronos/Kconfig
To build a Baremetal Architecture image:
Select
Safety Island Actuation Demofrom theUse-Casemenu.Select
Baremetalfrom theReference Software Stack Architecturemenu.Select
Build.
Run the FVP
To start the FVP and connect to the Primary Compute terminal (running Linux):
kas shell -c "../layers/meta-arm/scripts/runfvp -t tmux --verbose"
The user should wait for the system to boot and for the Linux prompt to appear.
The Reference Software Stack running on the Primary Compute can be logged into
as root user without a password in the Linux terminal. Run the below
command to guarantee that all the expected services have been
initialized.
systemctl is-system-running --wait
Wait for it to return. The expected terminal output is running.
Run the Demo
The demo consists of a TLS server and a TLS client. Refer to Parsec-enabled TLS Demo for more information on this application.
Run
ssl_serverfrom the Primary Compute terminal in the background and press theEnterkey to continue:ssl_server &
A message similar to the following should appear:
. Seeding the random number generator... ok . Loading the server cert. and key... ok . Bind on https://localhost:4433/ ... ok . Setting up the SSL data.... ok . Waiting for a remote connection ...
The TLS client can take an optional parameter as the TLS server IP address. The default value of the parameter is
localhost.Run
ssl_client1from the Primary Compute terminal in a container:docker run --rm -v /run/parsec/parsec.sock:/run/parsec/parsec.sock -v /usr/bin/ssl_client1:/usr/bin/ssl_client1 --network host docker.io/library/ubuntu:22.04 ssl_client1
After a few seconds, a message similar to the following should appear:
. Seeding the random number generator... ok . Loading the CA root certificate ... ok (0 skipped) . Connecting to tcp/localhost/4433... ok . Setting up the SSL/TLS structure... ok . Performing the SSL/TLS handshake... ok . Verifying peer X.509 certificate... ok > Write to server: 18 bytes written GET / HTTP/1.0 < Read from server: 156 bytes read HTTP/1.0 200 OK Content-Type: text/html <h2>mbed TLS Test Server</h2> <p>Successful connection using: TLS-ECDHE-RSA-WITH-CHACHA20-POLY1305-SHA256</p>
Stop the TLS server and synchronize the container image to the persistent storage:
pkill ssl_server sync
To shut down the FVP and terminate the emulation automatically, issue the following command on the Primary Compute terminal.
shutdown now
The below messages indicate the shutdown process is complete.
[  OK  ] Finished System Power Off.
[  OK  ] Reached target System Power Off.
reboot: Power down
Automated Validation
For more details about the validation of Parsec demo, refer to Integration Tests Validating the Parsec-enabled TLS Demo.
To run the configuration menu:
kas menu kronos/Kconfig
To run the validation tests:
Select
Safety Island Actuation DemoasUse-Case.Select
Baremetalfrom theReference Software Stack Architecturemenu.Select
Run Automated Validationfrom theRuntime Validation Setupmenu.Select
Build.
The complete test suite takes around 45 minutes to complete. See Integration Tests Validating the Parsec-enabled TLS Demo for more details.
The following messages are expected in the output to validate this Use-Case:
RESULTS - test_40_parsec.ParsecTest.test_parsec_demo: PASSED (479.25s)
Note
There is a rare known failure where a timeout might occur during test execution. Refer to Known Issues for possible workarounds.
Primary Compute PSA Protected Storage and Crypto APIs Architecture Test Suite
The demo can be run on the Baremetal Architecture. Refer to
Primary Compute Secure Services for more information on this
application. This demo is included as part of the Critical Application
Monitoring Demo.
Baremetal Architecture
Build
To run the configuration menu:
kas menu kronos/Kconfig
To build a Baremetal Architecture image:
Select
Critical Application Monitoring Demofrom theUse-Casemenu.Select
Baremetalfrom theReference Stack Architecturemenu.Select
Build.
Run the FVP
To start the FVP and connect to the Primary Compute terminal (running Linux):
kas shell -c "../layers/meta-arm/scripts/runfvp -t tmux --verbose"
The user should wait for the system to boot and for the Linux prompt to appear.
The Reference Software Stack running on the Primary Compute can be logged into
as root user without a password in the Linux terminal. Run the below
command to guarantee that all the expected services have been
initialized.
systemctl is-system-running --wait
Wait for it to return. The expected terminal output is running.
Run the Demo
The demo consists of simple tests run from the Linux terminal. Refer to Primary Compute Secure Services for more information on this application.
Run the PSA Crypto API tests from the Primary Compute terminal using the following command:
psa-crypto-api-test
A message similar to the following should appear once the tests have completed:
************ Crypto Suite Report ********** TOTAL TESTS : 59 TOTAL PASSED : 59 TOTAL SIM ERROR : 0 TOTAL FAILED : 0 TOTAL SKIPPED : 0 ******************************************
Run the PSA Protected Storage API tests from the Primary Compute terminal using the following command:
psa-ps-api-test
A message similar to the following should appear once the tests have completed:
************ Storage Suite Report ********** TOTAL TESTS : 17 TOTAL PASSED : 11 TOTAL SIM ERROR : 0 TOTAL FAILED : 0 TOTAL SKIPPED : 6 ******************************************
To shut down the FVP and terminate the emulation automatically, issue the following command on the Primary Compute terminal.
shutdown now
The below messages indicate the shutdown process is complete.
[  OK  ] Finished System Power Off.
[  OK  ] Reached target System Power Off.
reboot: Power down
Automated Validation
For more details about the validation of PSA Architecture Test Suite, refer to Integration Tests Validating Primary Compute PSA APIs Architecture Test Suite.
To run the configuration menu:
kas menu kronos/Kconfig
To run the validation tests:
Select
Critical Application Monitoring DemoasUse-Case.Select
Baremetalfrom theReference Stack Architecturemenu.Select
Run Automated Validationfrom theRuntime Validation Setupmenu.Select
Build.
The complete test suite takes around 40 minutes to complete. See Integration Tests Validating Primary Compute PSA APIs Architecture Test Suite for more details.
The following messages are expected in the output to validate this Use-Case:
RESULTS - test_50_trusted_services.KronosTrustedServices.test_03_psa_crypto_api_test: PASSED (298.70s)
RESULTS - test_50_trusted_services.KronosTrustedServices.test_05_psa_ps_api_test: PASSED (68.88s)
Note
There is a rare known failure where a timeout might occur during test execution. Refer to Known Issues for possible workarounds.
Safety Island PSA Secure Storage APIs Architecture Test Suite
The demo can be run on the Baremetal Architecture. See Safety Island PSA Architecture Test Suite for further details.
Baremetal Architecture
Build
To run the configuration menu:
kas menu kronos/Kconfig
To build a Baremetal Architecture image:
Select
Safety Island PSA Secure Storage APIs Architecture Test Suitefrom theUse-Casemenu.Select
Build.
Run the FVP
To start the FVP:
kas shell -c "../layers/meta-arm/scripts/runfvp -t tmux --verbose"
The Safety Island Cluster 2 terminal running the PSA Secure Storage APIs
Architecture Test Suite is available via the tmux window titled
terminal_uart_si_cluster2.
The Safety Island Cluster 2 tmux window can be accessed by typing Ctrl-b w,
using the arrow keys to select terminal_uart_si_cluster2 then pressing the
Enter key.
Run the Demo
The tests will automatically run. A log similar to the following should be visible; it is normal for some tests to be skipped but there should be no failed tests:
***** PSA Architecture Test Suite - Version 1.4 *****
Running.. Storage Suite
******************************************
TEST: 401 | DESCRIPTION: UID not found check | UT: STORAGE
[Info] Executing tests from non-secure
[Info] Executing ITS Tests
[Check 1] Call get API for UID 6 which is not set
[Check 2] Call get_info API for UID 6 which is not set
[Check 3] Call remove API for UID 6 which is not set
[Check 4] Call get API for UID 6 which is removed
[Check 5] Call get_info API for UID 6 which is removed
[Check 6] Call remove API for UID 6 which is removed
Set storage for UID 6
[Check 7] Call get API for different UID 5
[Check 8] Call get_info API for different UID 5
[Check 9] Call remove API for different UID 5
[Info] Executing PS Tests
[Check 1] Call get API for UID 6 which is not set
[Check 2] Call get_info API for UID 6 which is not set
[Check 3] Call remove API for UID 6 which is not set
[Check 4] Call get API for UID 6 which is removed
[Check 5] Call get_info API for UID 6 which is removed
[Check 6] Call remove API for UID 6 which is removed
Set storage for UID 6
[Check 7] Call get API for different UID 5
[Check 8] Call get_info API for different UID 5
[Check 9] Call remove API for different UID 5
TEST RESULT: PASSED
******************************************
<further tests removed from log for brevity>
************ Storage Suite Report **********
TOTAL TESTS     : 17
TOTAL PASSED    : 11
TOTAL SIM ERROR : 0
TOTAL FAILED    : 0
TOTAL SKIPPED   : 6
******************************************
To shut down the FVP and terminate the emulation, select the terminal titled as
python3 where the runfvp was launched by pressing Ctrl-b 0 and press
Ctrl-c to stop the FVP process.
Automated Validation
To run the configuration menu:
kas menu kronos/Kconfig
To run the validation tests:
Select
Safety Island PSA Secure Storage APIs Architecture Test Suitefrom theUse-Casemenu.Select
Run Automated Validationfrom theRuntime Validation Setupmenu.Select
Build.
The complete test suite takes around 15 minutes to complete. See Integration Tests Validating Safety Island PSA APIs Architecture Test Suite for more details.
The following message is expected in the output to validate this Use-Case:
RESULTS - test_10_si_psa_arch_tests.SIPSAArchTests.test_psa_si_cluster2: PASSED (0.00s)
Note
There is a rare known failure where a timeout might occur during test execution. Refer to Known Issues for possible workarounds.
Safety Island PSA Crypto APIs Architecture Test Suite
The demo can be run on the Baremetal Architecture. See Safety Island PSA Architecture Test Suite for further details.
Baremetal Architecture
Build
To run the configuration menu:
kas menu kronos/Kconfig
To build a Baremetal Architecture image:
Select
Safety Island PSA Crypto APIs Architecture Test Suitefrom theUse-Casemenu.Select
Build.
Run the FVP
To start the FVP:
kas shell -c "../layers/meta-arm/scripts/runfvp -t tmux --verbose"
The PSA Crypto APIs Architecture Test Suite is deployed on all the 3 Safety
Island (SI) Clusters. The test results can be seen on the following tmux
windows:
terminal_uart_si_cluster0
terminal_uart_si_cluster1
terminal_uart_si_cluster2
The user can navigate through the windows mentioned above by pressing
Ctrl-b w and arrow keys followed by the Enter key.
Run the tests
The tests will automatically run after the FVP is started. The complete test suite takes around 5 minutes to complete. When the tests finish, a log similar to the following should be visible. Normally no failure should be seen:
************ Crypto Suite Report **********
TOTAL TESTS     : 61
TOTAL PASSED    : 61
TOTAL SIM ERROR : 0
TOTAL FAILED    : 0
TOTAL SKIPPED   : 0
******************************************
To shut down the FVP and terminate the emulation, select the terminal titled as
python3 where the runfvp was launched by pressing Ctrl-b 0 and press
Ctrl-c to stop the FVP process.
Note
This use-case does not require waiting for the Primary Compute to boot.
Automated Validation
To run the configuration menu:
kas menu kronos/Kconfig
To run the validation tests:
Select
Safety Island PSA Crypto APIs Architecture Test Suitefrom theUse-Casemenu.Select
Run Automated Validationfrom theRuntime Validation Setupmenu.Select
Build.
The complete test suite takes around 35 minutes to complete. See Integration Tests Validating Safety Island PSA APIs Architecture Test Suite for more details.
The following messages are expected in the output to validate this Use-Case:
RESULTS - test_10_si_psa_arch_tests.SIPSAArchTests.test_psa_si_cluster0: PASSED (0.01s)
RESULTS - test_10_si_psa_arch_tests.SIPSAArchTests.test_psa_si_cluster1: PASSED (0.01s)
RESULTS - test_10_si_psa_arch_tests.SIPSAArchTests.test_psa_si_cluster2: PASSED (0.01s)
Note
There is a rare known failure where a timeout might occur during test execution. Refer to Known Issues for possible workarounds.
Fault Management Demo
The demo uses the Safety Island Cluster 1 console and it can be run on the Baremetal Architecture of the Safety Island Actuation Demo. Refer to Fault Management for further details.
Baremetal Architecture
Build
To run the configuration menu:
kas menu kronos/Kconfig
To build the Baremetal Architecture image:
Select
Safety Island Actuation Demofrom theUse-Casemenu.Select
Baremetalfrom theReference Software Stack Architecturemenu.Select
Build.
Run the FVP
To start the FVP:
kas shell -c "../layers/meta-arm/scripts/runfvp -t tmux --verbose"
The Fault Management subsystem is deployed on Safety Island Cluster 1 so the instructions below should be executed on its terminal.
The Safety Island Cluster 1 tmux window can be accessed by typing Ctrl-b w,
using the arrow keys to select terminal_uart_si_cluster1 then pressing the
Enter key.
Run the Demo
The instructions below demonstrate injecting faults into both the System FMU and GIC-720AE FMU and how this affects the SSU safety state.
Start by enumerating the configured fault device tree:
fault treeThe output shows the root fault device
fmu@2a510000(the System FMU), after which are the attached safety state devicessu@2a500000and fault devicefmu@2a570000(the GIC-720AE FMU):Root 0: fmu@2a510000 Safety: ssu@2a500000 Slot 0: fmu@2a570000After booting, query the initial state of the SSU:
fault safety_status ssu@2a500000The initial state is TEST:
Status: TEST (0x0)It is expected that a Fault Management deployment would perform a self-test after boot then signal its outcome to the SSU. For demonstration purposes, simulate a successful self-test completion by issuing the
compl_oksignal to the SSU:fault safety_control ssu@2a500000 compl_okThe system is now
SAFEfor operation:Signal: compl_ok (0x0) State: SAFE (0x3)Simulate an internal Lockstep error (
0x4) in the System FMU:fault inject fmu@2a510000 0x4Three events are logged:
The subsystem reports that it received the fault and that it was non-critical (all System FMU internal faults are non-critical).
The safety component reports that this caused the SSU to enter the
ERRNstate.The storage component reports that the total historical fault count for this fault on this device is now
1.Injecting fault 0x4 to device fmu@2a510000 [00:04:49.110,000] <inf> fault_mgmt: Fault received (non-critical): 0x4 on fmu@2a510000 [00:04:49.110,000] <inf> fault_mgmt_safety: Safety status: ERRN (0x5) on ssu@2a500000 [00:04:49.160,000] <inf> fault_mgmt_protected_storage: Fault count for 0x4 on fmu@2a510000: 1The SSU will remain in the
ERRNstate until signaled (unless a critical fault occurs). Send acompl_oksignal again to recover from this fault:fault safety_control ssu@2a500000 compl_okThe SSU is now in the
SAFEstate again:Signal: compl_ok (0x0) State: SAFE (0x3)Next, inject an SPI collator external error (
0x20000a00) into the GIC-720AE FMU:fault inject fmu@2a570000 0x20000a00This results in a similar output to above, except that the received fault was critical and the safety status is now
ERRC. (GIC-720AE FMU faults are critical by default, but this can be changed from the shell using thefault set_criticalsub-command).Injecting fault 0x20000a00 to device fmu@2a570000 [00:09:13.210,000] <inf> fault_mgmt: Fault received (critical): 0x20000a00 on fmu@2a570000 [00:09:13.210,000] <inf> fault_mgmt_safety: Safety status: ERRC (0x6) on ssu@2a500000 [00:09:13.270,000] <inf> fault_mgmt_protected_storage: Fault count for 0x20000a00 on fmu@2a570000: 1The number of occurrences of each fault is tracked per device by the storage component. Inject another Lockstep error into the System FMU:
fault inject fmu@2a510000 0x4The fault count is now
2. Note that the safety status is stillERRC.Injecting fault 0x4 to device fmu@2a510000 [00:14:02.800,000] <inf> fault_mgmt: Fault received (non-critical): 0x4 on fmu@2a510000 [00:14:02.800,000] <inf> fault_mgmt_safety: Safety status: ERRC (0x6) on ssu@2a500000 [00:14:02.860,000] <inf> fault_mgmt_protected_storage: Fault count for 0x4 on fmu@2a510000: 2The full list of stored faults can also be queried:
fault listThis shows all the faults injected into both FMUs above:
Fault history:
Fault received (non-critical): 0x4 on fmu@2a510000 : count 2

Fault received (critical): 0x20000a00 on fmu@2a570000 : count 1
The
ERRCrepresents a critical system failure and cannot be recovered by the software - confirm this by trying to issuecompl_okagain:fault safety_control ssu@2a500000 compl_okThe SSU status is still
ERRC:Signal: compl_ok (0x0) State: ERRC (0x6)The state can now only be affected through a full system reset (e.g. by stopping and starting the FVP), after which the state will be
TESTonce again.To shut down the FVP and terminate the emulation, select the terminal titled as
python3where therunfvpwas launched by pressingCtrl-b 0and pressCtrl-cto stop the FVP process.
See the Shell Reference for more details about these and other Fault Management shell sub-commands.
Automated Validation
To run the configuration menu:
kas menu kronos/Kconfig
To run the validation tests:
Select
Safety Island Actuation DemoasUse-Case.Select
Baremetalfrom theReference Software Stack Architecturemenu.Select
Run Automated Validationfrom theRuntime Validation Setupmenu.Select
Build.
The complete test suite takes around 45 minutes to complete. See Integration Tests Validating the Fault Management Subsystem for more details.
The following messages are expected in the output to validate this Use-Case:
RESULTS - test_10_fault_mgmt.FaultMgmtSSUTest.test_ssu_ce_not_ok: PASSED (38.18s)
RESULTS - test_10_fault_mgmt.FaultMgmtSSUTest.test_ssu_compl_ok: PASSED (30.66s)
RESULTS - test_10_fault_mgmt.FaultMgmtSSUTest.test_ssu_nce_ok: PASSED (29.24s)
RESULTS - test_10_fault_mgmt.FaultMgmtTest.test_fmu_fault_clear: PASSED (11.24s)
RESULTS - test_10_fault_mgmt.FaultMgmtTest.test_fmu_fault_count: PASSED (6.04s)
RESULTS - test_10_fault_mgmt.FaultMgmtTest.test_fmu_fault_list: PASSED (36.22s)
RESULTS - test_10_fault_mgmt.FaultMgmtTest.test_fmu_fault_summary: PASSED (22.64s)
RESULTS - test_10_fault_mgmt.FaultMgmtTest.test_gic_fmu_inject: PASSED (18.69s)
RESULTS - test_10_fault_mgmt.FaultMgmtTest.test_system_fmu_internal_inject: PASSED (8.77s)
RESULTS - test_10_fault_mgmt.FaultMgmtTest.test_system_fmu_internal_set_enabled: PASSED (11.09s)
RESULTS - test_10_fault_mgmt.FaultMgmtTest.test_tree: PASSED (0.71s)
Note
There is a rare known failure where a timeout might occur during test execution. Refer to Known Issues for possible workarounds.
Arm SystemReady IR Validation
Arm SystemReady IR Firmware Build
The Arm SystemReady IR Firmware Build option just builds the Arm SystemReady IR-aligned firmware. Refer to Arm SystemReady IR for more details.
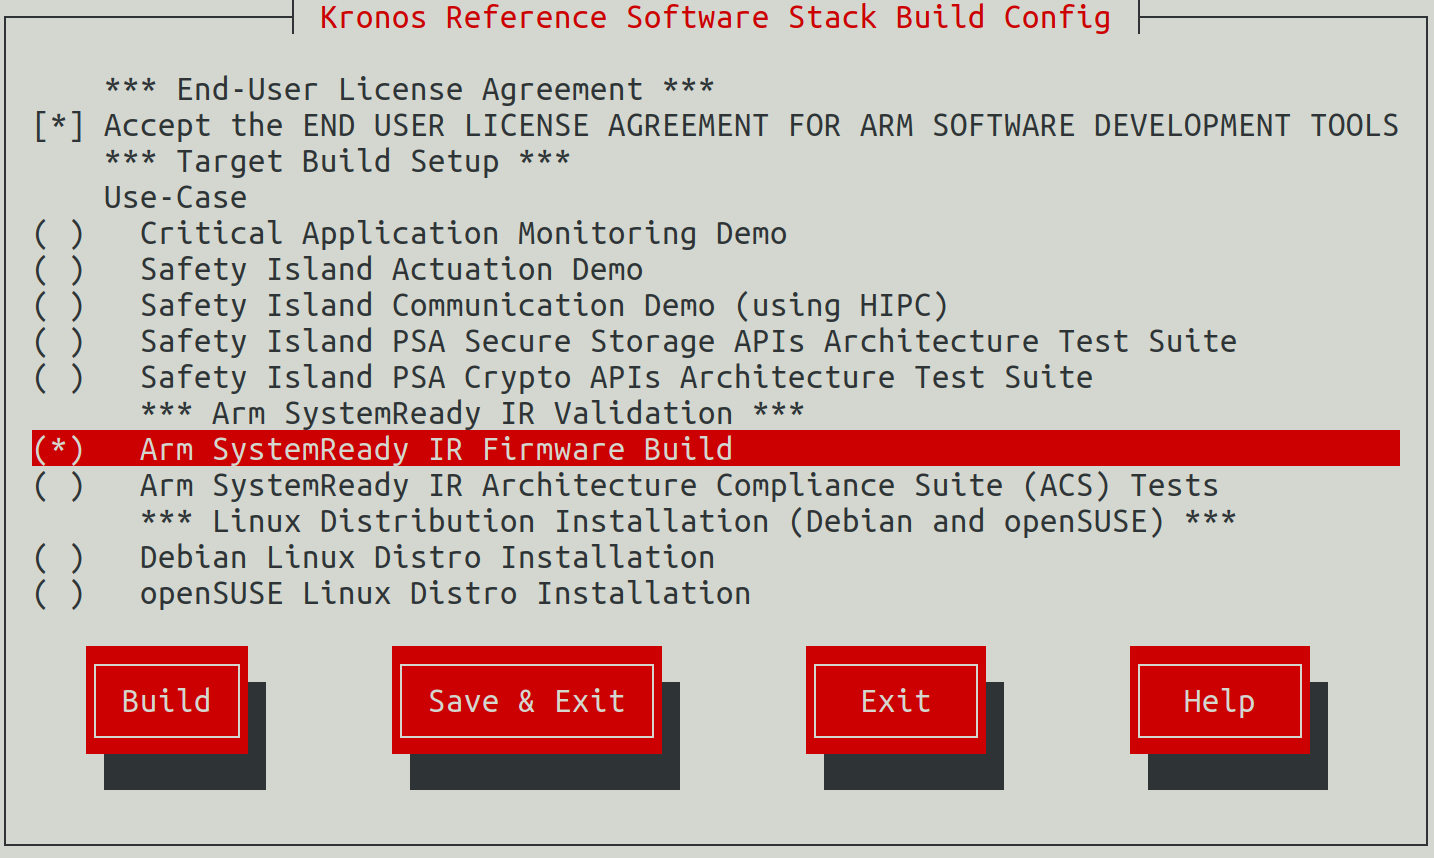
Build
To run the configuration menu:
kas menu kronos/Kconfig
To build the Arm SystemReady IR-aligned firmware image:
Select
Arm SystemReady IR Firmware BuildunderArm SystemReady IR Validationfrom theUse-Casemenu.Select
Build.
The firmware images listed below can be found in the directory
build/tmp_systemready-glibc/deploy/images/fvp-rd-kronos/.
ap-flash-image-fvp-rd-kronos.wic
encrypted_cm_provisioning_bundle_0.bin
encrypted_dm_provisioning_bundle.bin
rss-flash-image-fvp-rd-kronos.wic
rss-nvm-image.bin
rss-rom-image-fvp-rd-kronos.wic.nopt
Arm SystemReady IR Architecture Compliance Suite (ACS) Tests
The ACS for the Arm SystemReady IR certification is delivered through a live OS image, which enables the basic automation to run the tests.
The system will boot with the ACS live OS image and the ACS tests will run automatically after the system boots. See Arm SystemReady IR ACS Tests for more details.
Build and Automated Validation
To run the configuration menu:
kas menu kronos/Kconfig
To build and run the Arm SystemReady IR ACS tests:
Select
Arm SystemReady IR Architecture Compliance Suite (ACS) TestsunderArm SystemReady IR Validationfrom theUse-Casemenu.Select
Build.
A similar output to the following is printed out:
NOTE: recipe arm-systemready-ir-acs-2.1.0-r0: task do_testimage: Started
Creating terminal default on terminal_ns_uart0
Creating terminal tf-a on terminal_sec_uart
Creating terminal scp on terminal_uart_scp
Creating terminal lcp on terminal_uart_lcp
Creating terminal rss on terminal_rss_uart
Creating terminal safety_island_c0 on terminal_uart_si_cluster0
Creating terminal safety_island_c1 on terminal_uart_si_cluster1
Creating terminal safety_island_c2 on terminal_uart_si_cluster2
Test Group (PlatformSpecificElements): FAILED
Test Group (RequiredElements): FAILED
Test Group (CheckEvent_Conf): PASSED
Test Group (CheckEvent_Func): PASSED
Test Group (CloseEvent_Func): PASSED
Test Group (CreateEventEx_Conf): PASSED
Test Group (CreateEventEx_Func): PASSED
Test Group (CreateEvent_Conf): PASSED
Test Group (CreateEvent_Func): PASSED
Test Group (RaiseTPL_Func): PASSED
Test Group (RestoreTPL_Func): PASSED
Test Group (SetTimer_Conf): PASSED
Test Group (SetTimer_Func): PASSED
Test Group (SignalEvent_Func): PASSED
Test Group (WaitForEvent_Conf): PASSED
Test Group (WaitForEvent_Func): PASSED
Test Group (AllocatePages_Conf): PASSED
Test Group (AllocatePages_Func): PASSED
Test Group (AllocatePool_Conf): PASSED
Test Group (AllocatePool_Func): PASSED
Test Group (FreePages_Conf): PASSED
Test Group (FreePages_Func): PASSED
Test Group (GetMemoryMap_Conf): PASSED
Test Group (GetMemoryMap_Func): PASSED
...
...
Test Group (virtio_blk virtio1): vda
Test Group (Supported ports):
Linux tests complete
RESULTS:
RESULTS - arm_systemready_ir_acs.SystemReadyACSTest.test_acs: PASSED (32417.37s)
SUMMARY:
arm-systemready-ir-acs () - Ran 1 test in 32417.375s
arm-systemready-ir-acs - OK - All required tests passed (successes=1, skipped=0, failures=0, errors=0)
As seen in the above logs, some Test Groups are expected to fail. The following messages are expected to validate this Use-Case:
RESULTS - arm_systemready_ir_acs.SystemReadyACSTest.test_acs: PASSED (32417.37s)
Note
Running the ACS tests more than once will have them resume from where they last stopped. Additionally, consecutive runs are not supported by the ACS logs; it will result in a failure after the end of the tests. Use the following to re-start the entire test suite properly:
kas shell -c "bitbake arm-systemready-ir-acs -C unpack"
Note
The ACS tests take hours to complete. The actual time taken will vary depending on the performance of the build host. The default timeout setting for the tests is 12 hours for an x86_64 host or 24 hours for an aarch64 host. If a timeout failure occurs, increase the timeout setting and re-run the tests with the following command on the build host terminal. The example command below changes the timeout setting to 16 hours.
TEST_OVERALL_TIMEOUT="\${@16*60*60}" kas shell -c "bitbake arm-systemready-ir-acs -C unpack"
Note
There is a rare known failure where a timeout might occur during test execution. Refer to Known Issues for possible workarounds.
Refer to Arm SystemReady IR ACS Tests for an explanation on how the ACS tests are set up and how they work in the Reference Software Stack.
Linux Distribution Installation (Debian and openSUSE)
The Arm SystemReady IR-aligned firmware must boot at least two unmodified generic UEFI distribution images from an ISO image.
This Software Stack currently supports two Linux distributions: Debian Stable and openSUSE Leap.
Note
The installation of a Linux distribution requires some manual interaction, for example, some necessary selections or confirmations, entering the user and password, etc.
The whole installation process takes a long time (possibly up to 10 hours, or even longer).
We suggest that when running the Linux distribution installations the FVP is the only running process as it will consume large amounts of RAM that can make the system unstable.
Refer to Linux Distributions Installation Tests for an explanation on how the Linux distros installation is set up and how they work in the Reference Software Stack.
Debian
To install Debian, you can refer to the Debian GNU/Linux Installation Guide.
Distro Installation Media Preparation
To run the configuration menu:
kas menu kronos/Kconfig
To build the Arm SystemReady IR Linux distros installation tests:
Select
Debian Linux Distro InstallationunderLinux Distribution Installation (Debian and openSUSE)from theUse-Casemenu.Select
Build.
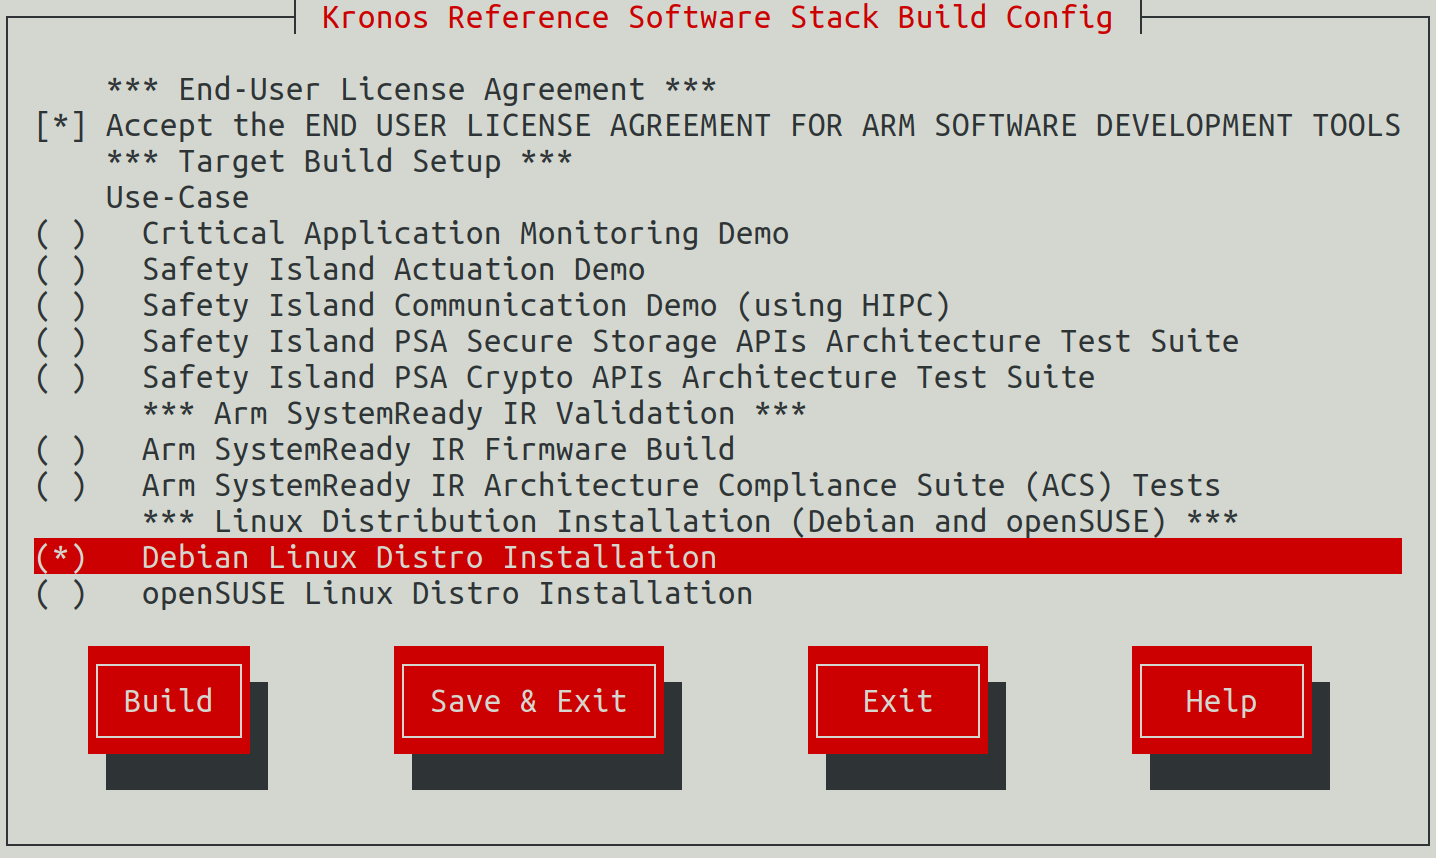
Distro Installation
Run the following command to start the installation:
kas shell -c "../layers/meta-arm/scripts/runfvp -t tmux --verbose"
The whole process of installing Debian will probably take about 5 hours. The install process begins when you see the following:
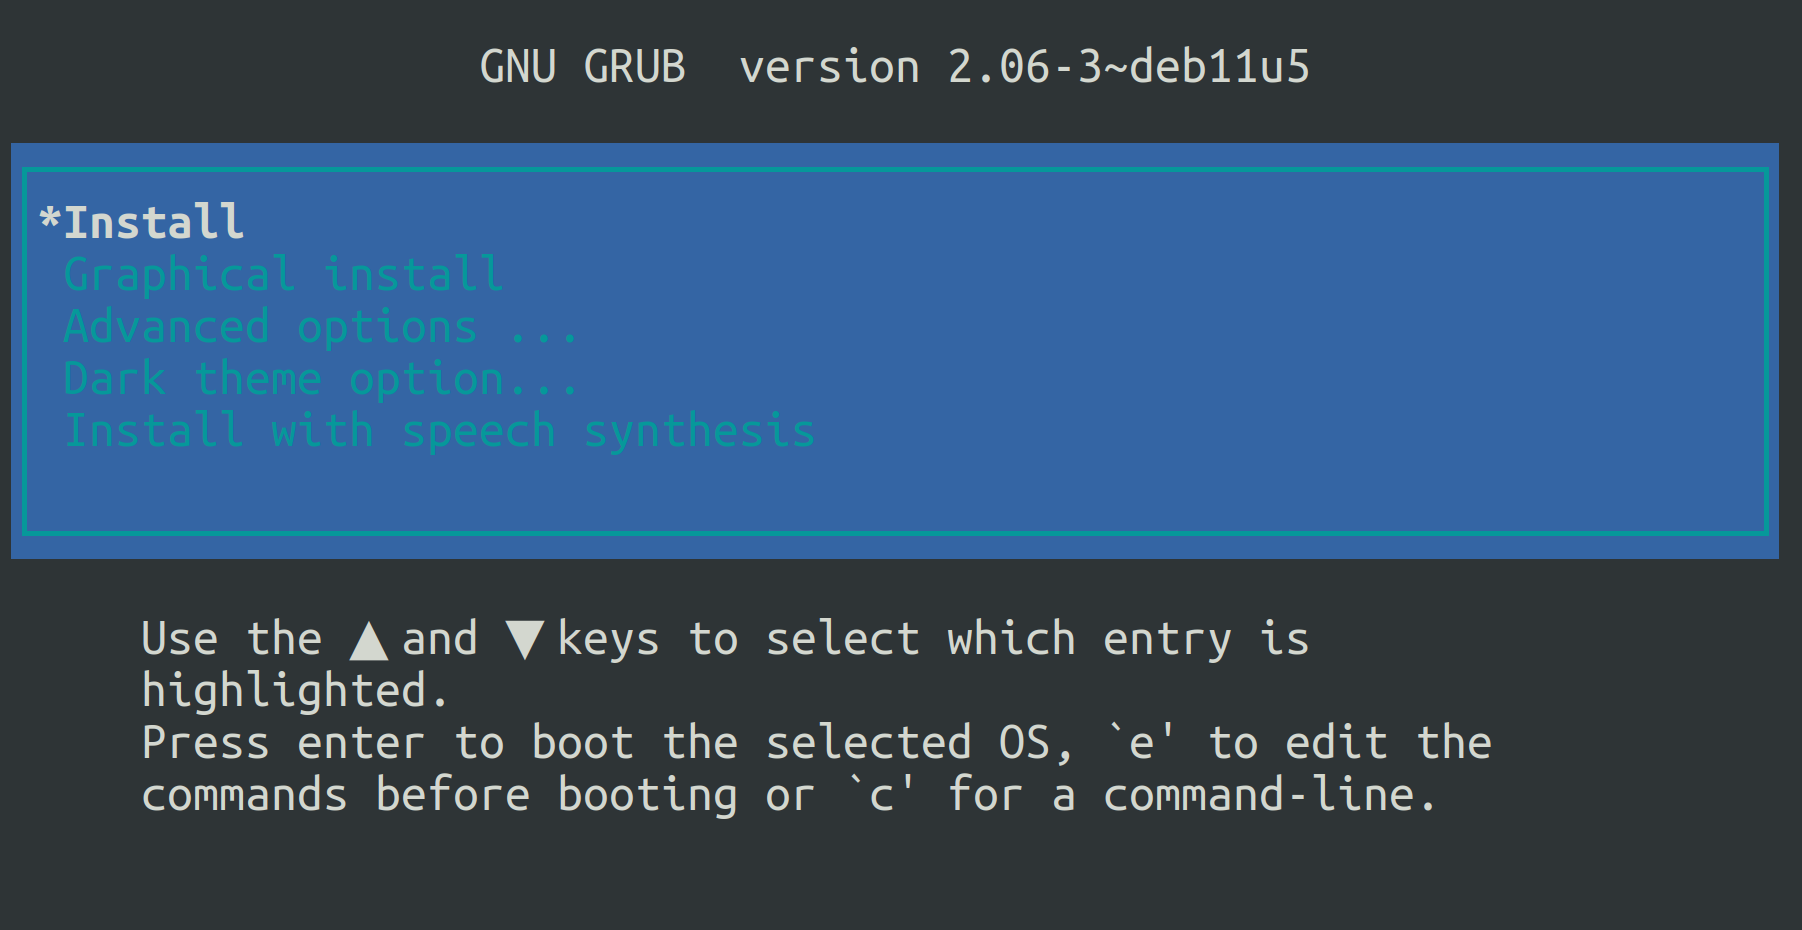
Select Install to start the installation process.
The following are problems that have been encountered during the Debian installation process and how to solve them:
Detect and mount installation media
After the installer starts, a tab titled
Detect and mount installation mediawill appear withNo device for installation media was detected.When prompted withLoad drivers from removable media?selectNoto continue.For
Manually select a module and device for installation media?selectYes.For
Module needed for accessing the installation media:selectnone.For
Device file for accessing the installation media:input/dev/mmcblk0as the device file for accessing the installation media, then selectContinue.
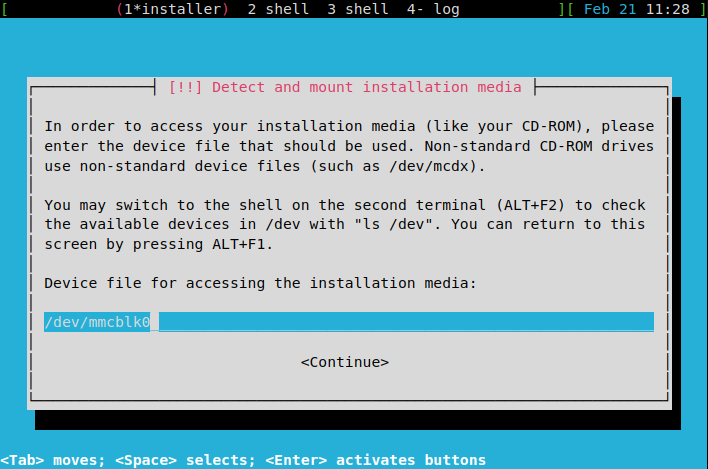
Install the GRUB boot loader
When the installation reaches the
Install the GRUB boot loaderphase, there will be an errorUnable to install GRUB in dummy. This is because on an EBBR platform, UEFISetVariable()is not required at runtime (however, it is required at boot time).
One workaround we have is to “execute a shell” when the GRUB install phase throws the above error. To execute a shell, press
Ctrl-a nto switch the debug shell, and run the following commands:chroot /target update-grub mkdir /boot/efi/EFI/BOOT cp -v /boot/efi/EFI/debian/grubaa64.efi /boot/efi/EFI/BOOT/bootaa64.efiA snapshot is as below:
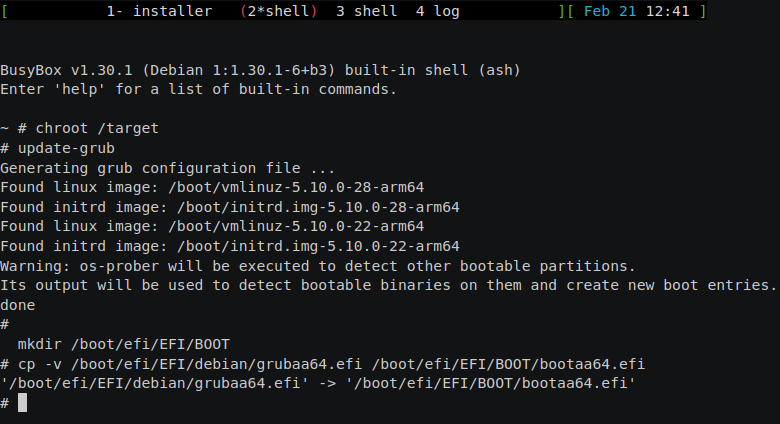
After doing the above GRUB workaround, press
Ctrl-a pto go back to the installer again. SelectContinueon the GRUB failure screen.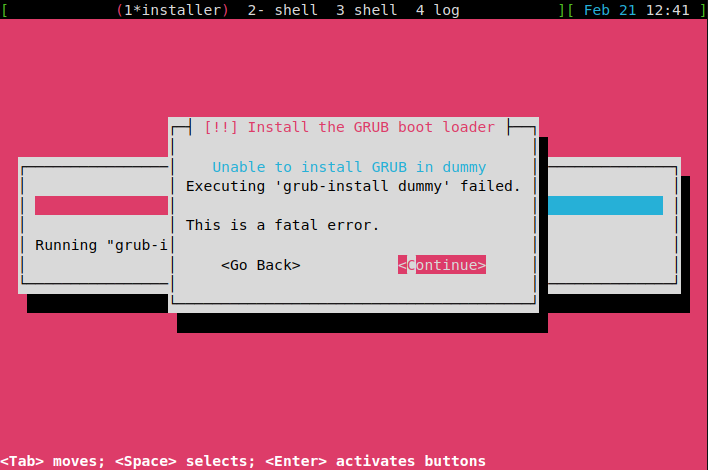
Select
Continue without boot loaderin theDebian installer main menuand continue.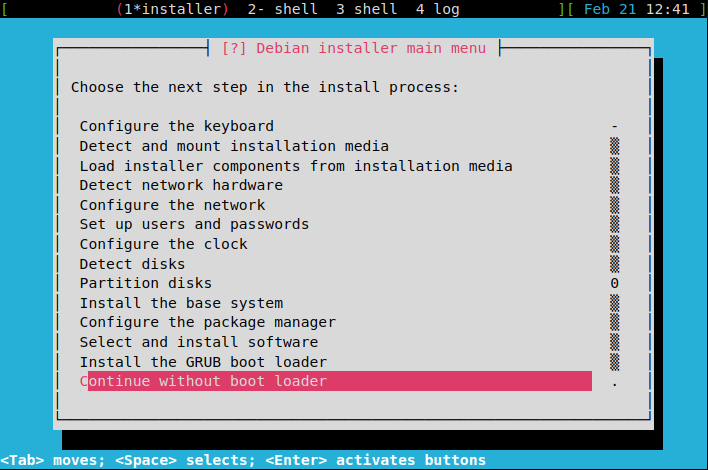
Log in
When the installation reaches the final
Finishing the installationphase, you will need to wait some time to finish the remaining tasks, and then it will automatically reboot into the installed OS. You can log into the Linux shell with the user created during installation.Terminate the FVP
To shut down the FVP and terminate the emulation automatically, log into the Linux shell as the root user then run the following command.
shutdown now
The below message indicates the shutdown process is complete.
reboot: Power down
Subsequently running the FVP will boot into Debian.
openSUSE
To install openSUSE, you can refer to the openSUSE Installation Guide.
Distro Installation Media Preparation
To run the configuration menu:
kas menu kronos/Kconfig
To build the Arm SystemReady IR Linux distros installation tests:
Select
openSUSE Linux Distro InstallationunderLinux Distribution Installation (Debian and openSUSE)from theUse-Casemenu.Select
Build.
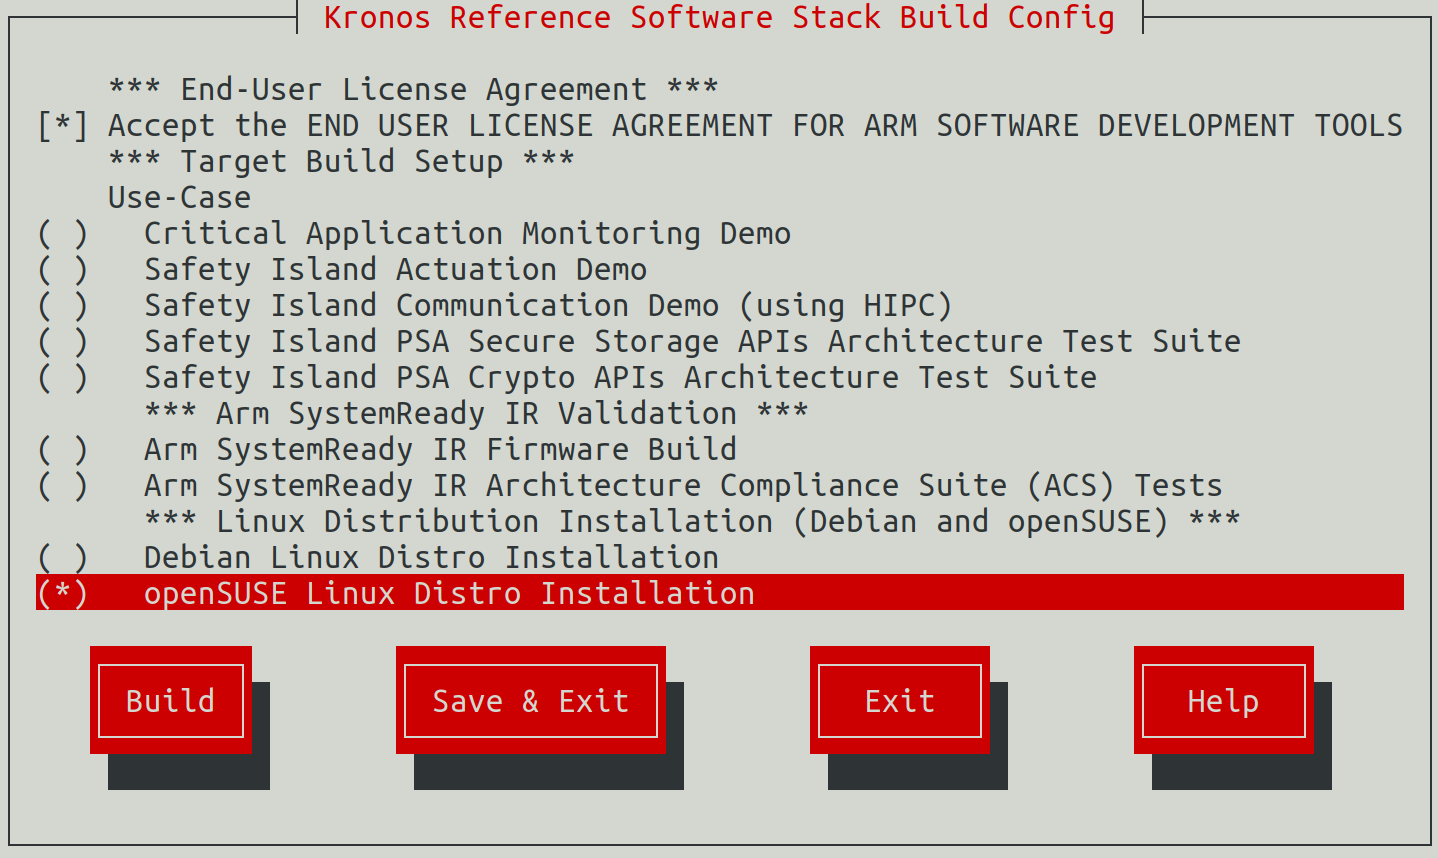
Distro Installation
Run the following command to start the installation:
kas shell -c "../layers/meta-arm/scripts/runfvp -t tmux --verbose"
The whole process of installing openSUSE will take several hours. The install process begins when you see the following:
Select Installation to start the installation process.
System Role
When you get to the
System Rolescreen, selectServer, then selectNextto continue with the installation.
Tip
Use
Tabto cycle through options on screens during installation.Installation process
Once you have selected
Installon theConfirm Installationscreen, the installation will proceed and it will take several hours. The steps of the installation process are:Installing Packages...Save configurationSave installation settingsInstall boot managerPrepare system for initial bootThen the system will reboot automatically in 10s, you can select
OKto reboot immediately.
Log in
After the reboot process, log into the Linux shell with the user created during installation.
Terminate the FVP
To shut down the FVP and terminate the emulation automatically, run the following command.
sudo shutdown now
The below message indicates the shutdown process is complete.
reboot: Power down
Subsequently running the FVP will boot into openSUSE.
Secure Firmware Update
Currently, Secure Firmware Update is only available in the Baremetal Architecture.
Baremetal Architecture
Build
The to be updated firmware capsule for testing will be generated together with the image for the software stack when building. The firmware capsule is placed on a removable storage device (in the case of Kronos, an MMC card implementation in the FVP).
Ensure the creation of the initial firmware flash images because previously updated firmware will lead to failure of the secure firmware update tests.
kas shell -c "bitbake ap-flash-image rss-flash-image -C image"
To run the configuration menu:
kas menu kronos/Kconfig
To build a Baremetal Architecture image:
Select
Critical Application Monitoring Demofrom theUse-Casemenu.Select
Baremetalfrom theReference Software Stack Architecturemenu.Select
Build.
Run the FVP
To start the FVP and connect to the Primary Compute terminal (running Linux):
kas shell -c "../layers/meta-arm/scripts/runfvp -t tmux --verbose"
Note that the main tmux windows involved in the Secure Firmware Update are
terminal_ns_uart0 and terminal_rss_uart. For ease of navigation, it is
recommended to join these in a single window with two panes.
Follow the steps below to achieve the same:
Ensure that the tmux window titled
terminal_ns_uart0is selected. If not, pressCtrl-b wfrom the tmux session, navigate to the tmux window titledterminal_ns_uart0followed by pressing theEnterkey.The user should wait for the U-Boot
Hit any key to stop autobootto appear.Press any key before the time limit to enter the U-Boot shell.
Press
Ctrl-b :and then typejoin-pane -s :terminal_rss_uart -hfollowed by pressing theEnterkey to join the RSS terminal window to the Primary Compute terminal window.
Refer to the following image of the tmux panes rearrangement. Panes can
be navigated using Ctrl-b followed by the arrow keys.
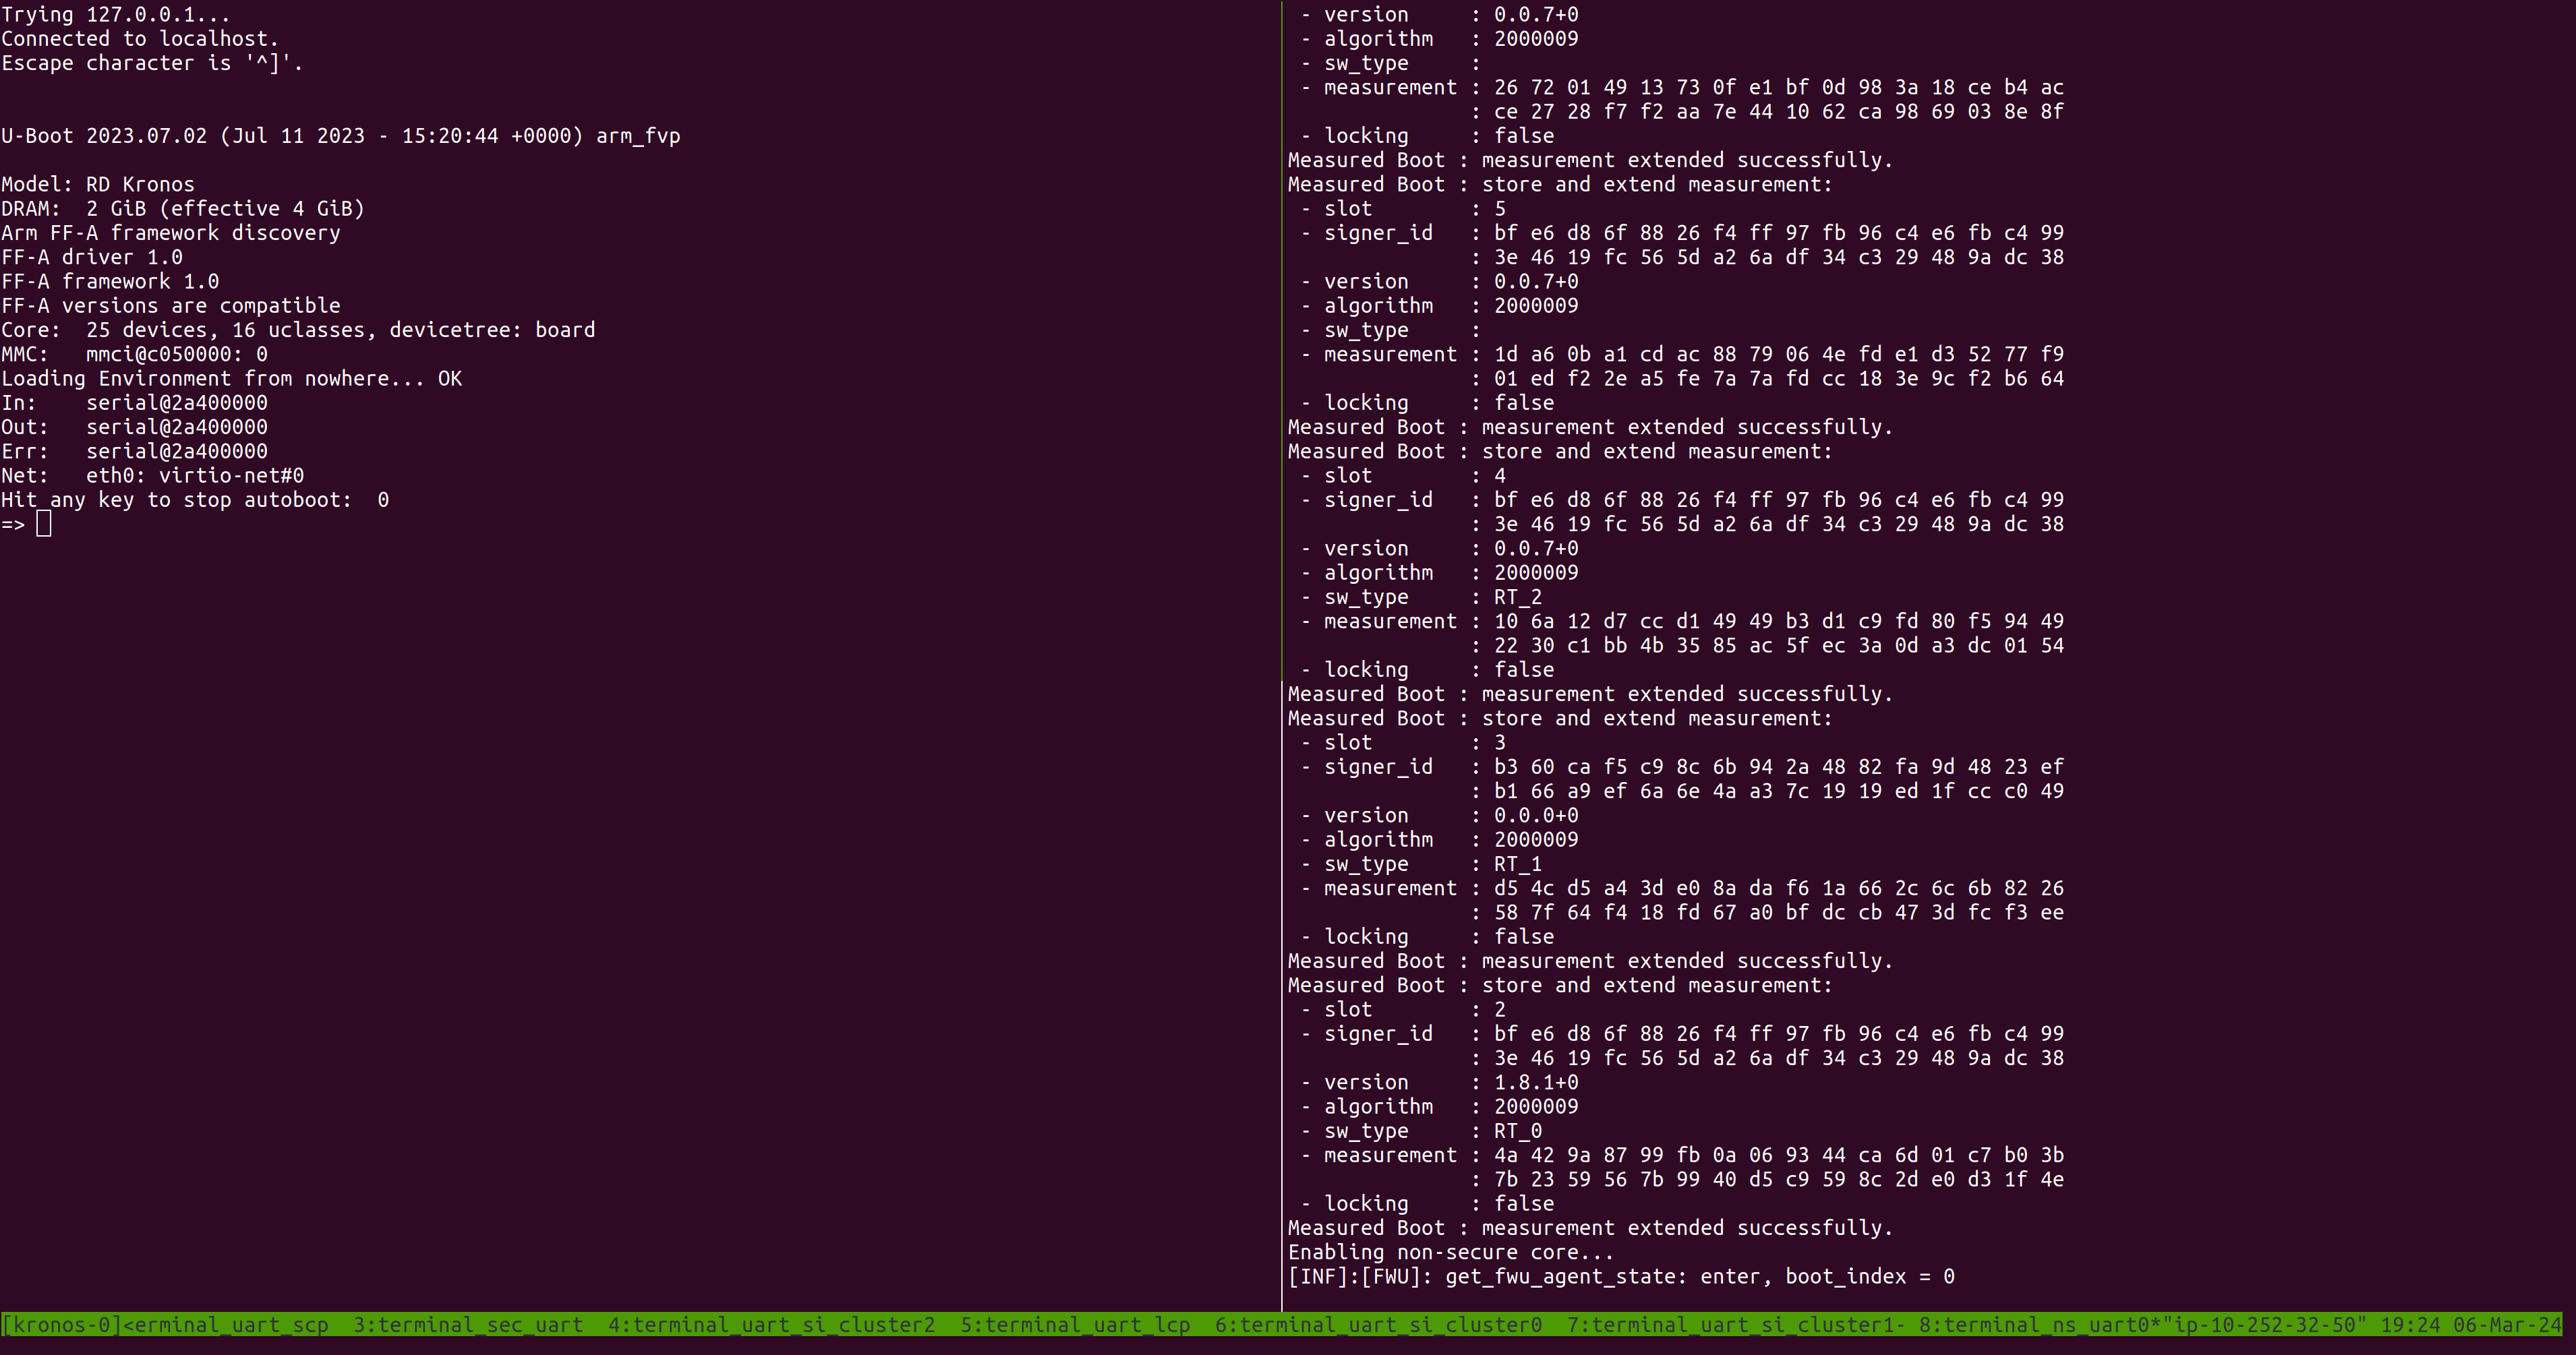
Run the Demo
To start Secure Firmware Update:
In the U-Boot shell, run the following commands to start Secure Firmware Update:
Note
Each command should be copied and pasted individually to the U-Boot shell.
fatload mmc 0:1 0xa2000000 fw.cap
efidebug capsule update -v 0xa2000000
The system will automatically start upgrading the firmware capsule. Note: This time there is no need to press any keys.
The following logs indicate that the upgrade process has started and is in progress.
In
terminal_ns_uart0:FF-A driver 1.0 FF-A framework 1.0 FF-A versions are compatible EFI: MM partition ID 0x8003 EFI: FVP: Capsule shared buffer at 0x81000000 , size 8192 pages
In
terminal_rss_uart:[INF]:[FWU]: get_fwu_agent_state: enter, boot_index = 0 [INF]:[FWU]: get_fwu_agent_state: enter, boot_index = 0 [INF]:[FWU]: FMP image update: image id = 1 [INF]:[FWU]: FMP image update: status = 0, version=7, last_attempt_version=0. [INF]: [FWU]: Host acknowledged. [INF]:[FWU]: pack_image_info:207 ImageInfo size = 105, ImageName size = 14, ImageVersionName size = 14 [INF]: [FWU]: Getting image info succeeded. [INF]:[FWU]: get_fwu_agent_state: enter, boot_index = 0 [INF]:[FWU]: uefi_capsule_retrieve_images: enter, capsule ptr = 0x0x65000000 [INF]:[FWU]: uefi_capsule_retrieve_images: capsule size = 18284656, image count = 1 [INF]:[FWU]: uefi_capsule_retrieve_images: image 0, version = 3 [INF]:[FWU]: uefi_capsule_retrieve_images: image 0 at 0x65000070, size=18284560 [INF]:[FWU]: flash_rss_capsule: enter: image = 0x65000070, size = 16187408, version = 3 [INF]:[FWU]: erase_bank: erasing sectors = 4080, from offset = 16748544 [INF]:[FWU]: flash_rss_capsule: writing capsule to the flash at offset = 16748544...
Note: This step will take about 10 minutes.
The system will reset after a successful firmware update and boot with the updated firmware. This can be confirmed by checking the terminal logs; if there are lines in the log like below, then the upgrade was successful and the system has successfully rebooted with the updated firmware.
In
terminal_rss_uart:[INF]: [FWU]: Flashing the image succeeded. [INF]: [FWU]: Performing system reset... ... ... [INF]:[FWU]: get_fwu_agent_state: enter, boot_index = 1
The system will eventually boot into Linux using the upgraded firmware.
To shut down the FVP and terminate the emulation, select the terminal titled as
python3where therunfvpwas launched by pressingCtrl-b 0and pressCtrl-cto stop the FVP process.
Automated Validation
Ensure the creation of the initial firmware flash images because previously updated firmware will lead to failure of the tests.
kas shell -c "bitbake ap-flash-image rss-flash-image -C image"
To run the configuration menu:
kas menu kronos/Kconfig
To run the validation tests:
Select
Critical Application Monitoring DemoasUse-Case.Select
Baremetalfrom theReference Software Stack Architecturemenu.Select
Run Automated Validationfrom theRuntime Validation Setupmenu.Select
Build.
The following messages are expected in the output to validate this Use-Case:
RESULTS - test_00_fwu.SecureFirmwareUpdateTest.test_securefirmwareupdate: PASSED (414.85s)
Note
There is a rare known failure where a timeout might occur during test execution. Refer to Known Issues for possible workarounds.
See Integration Tests Validating Secure Firmware Update for more details.